Figure 5.
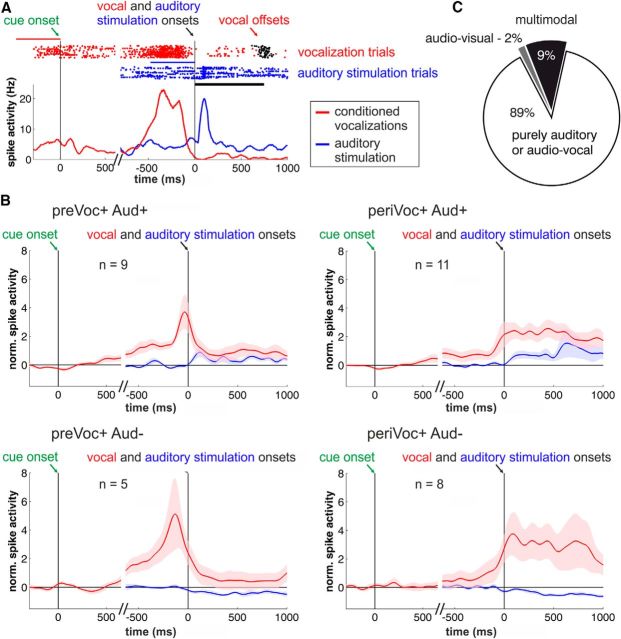
Audio-vocal activity in PFC neurons. A, Example neuron showing a phasic response during auditory stimulation and ramping neuronal activity before voluntary vocalizations. Top, Raster plot. Bottom, Represents the corresponding spike-density histogram averaged and smoothed with a Gaussian kernel (100 ms) for illustration. The blue and red lines indicate in which trial period the baseline firing rate was estimated (blue for auditory and red for vocal responses). B, Averaged and normalized population responses of auditory neurons subdivided into neurons showing increased (Aud+) or suppressed (Aud−) responses during auditory stimulation (blue curves) with an additional significant increase in neuronal activity before vocal output (preVoc+) or during conditioned vocal output (periVoc+; red curves). There are no significant differences in firing rates due to the visual cue stimuli. Vocalization-correlated activity is triggered by vocal onset and auditory response by the onset of the auditory stimuli (right, top and bottom); visual response by go-cue onset (left, top and bottom). C, Fractions of auditory neurons that also showed visual (1/54 neurons) as well as visual and prevocal and/or perivocal activity (multimodal neurons 5/54).

