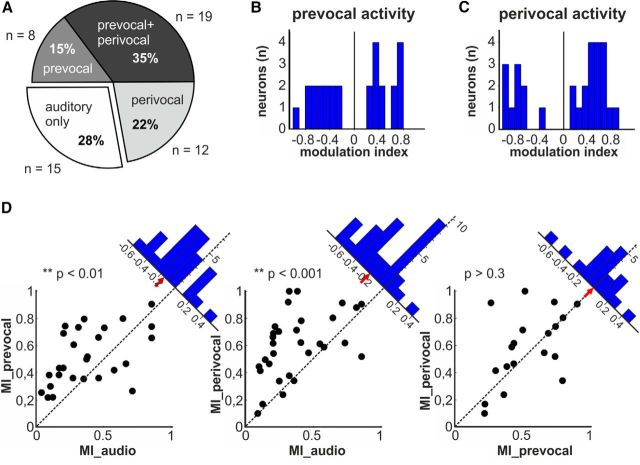
Figure 7.
Pre vocal and perivocal activity of auditory neurons. A, Fractions of auditory neurons that also showed prevocal (8/54), perivocal (12/54), or both types of activation (19/54). B, C, Distribution of the modulation indices of auditory neurons showing significant modulation before conditioned vocal output (B) and/or during conditioned vocal output (C). D, Scatter plots of auditory neurons as a function of their absolute values of their modulation indices. Each dot represents one neuron with its corresponding absolute value of its modulation index in response to auditory stimulation (MI_audio) and before (MI_prevocal) and during self-produced vocalizations (MI_perivocal). Insets indicate the distance of the dot to the bisection line. Positive values were assigned to dots below the line (modulation index on abscissa higher than on the ordinate) and negative values to dots above the line (modulation index on abscissa lower than on the ordinate). Red arrows mark the median distance to the bisection line.

