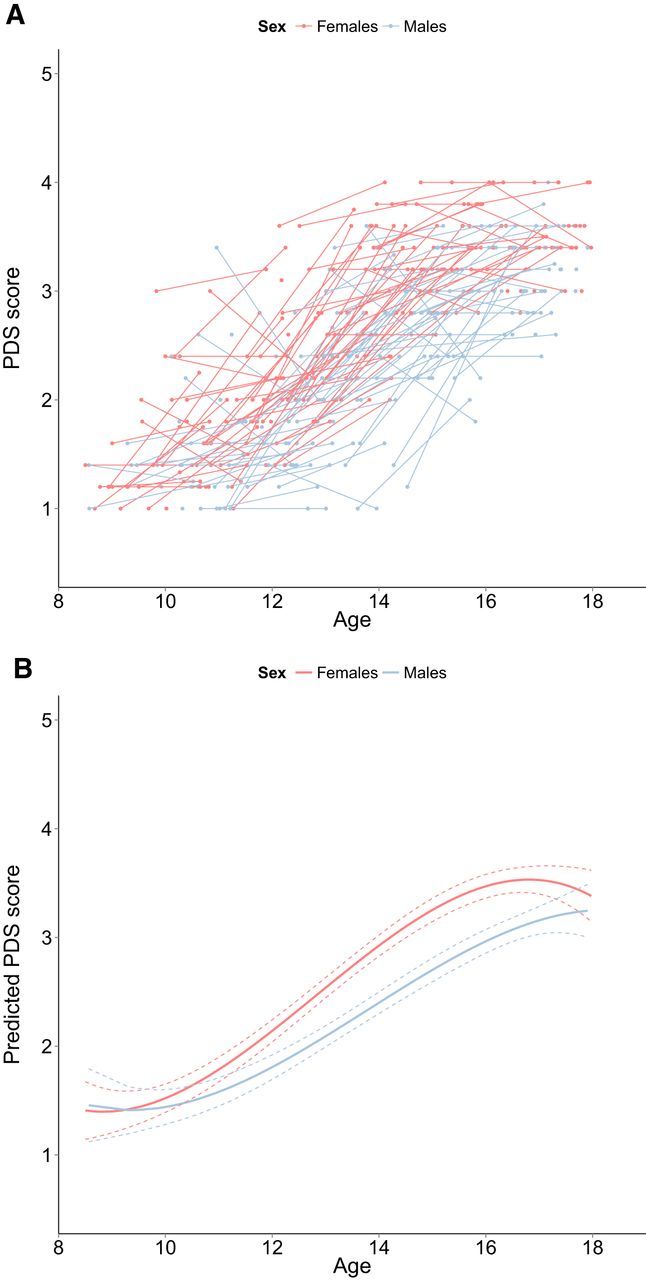
Figure 5.

A, Longitudinal graphic representation of age at both time points and PDS scores on both time points. Individual subjects are represented by individual lines Subjects measured only once are represented by points. B, Predicted values for PDS scores based on the optimal fitting model. Dotted lines represent 95% confidence interval.
