Figure 4.

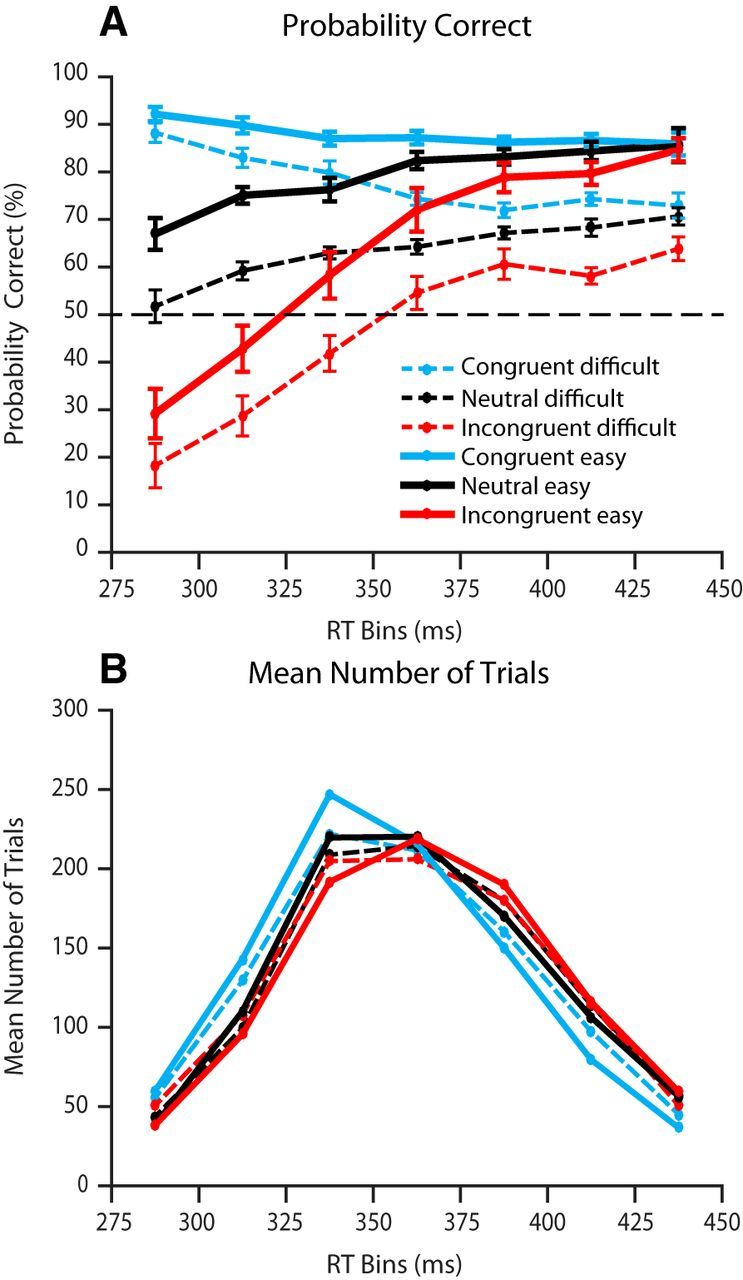
A, B, Probability correct (A) and mean number of trials (B) for each RT bin for neutral (black), congruent (blue), and incongruent (red) trials. Values on the x-axis correspond to the midpoint of each RT bin in milliseconds. Probability correct is higher for easy stimuli (5-pixel shift) compared with difficult stimuli (2-pixel shift). In the congruent and incongruent conditions, responses were more likely to be in the direction of the higher-paying alternative when participants made fast responses. This bias declined as RT increased. In the neutral condition (black), accuracy increased as RT increased. For the conditional accuracy, SEs are shown by the vertical bars.
