Figure 7.

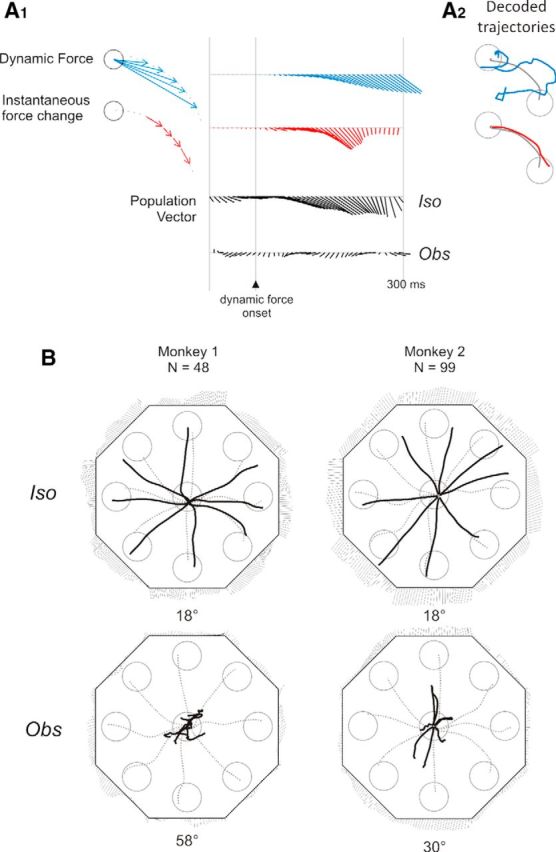
Population vectors and decoded trajectories of cursor motion. A1, Time series of the dynamic force (blue), the instantaneous force change (red), and the neural PV (black) in the Iso and Obs tasks, of Monkey 1 in one particular direction (315°), aligned to the onset of dynamic force. Left, Schematic vectorial representation of different forces. A2, The trajectories predicted by the PV on the basis of a “dynamic force” encoding hypothesis (blue curve) and of an “instantaneous force change” encoding hypothesis (red curve) are superimposed to the actual trajectory (gray curve). B, Decoded trajectory (black curve) of the cursor's motion toward the eight peripheral targets (circles), as predicted by the “instantaneous force change” encoding hypothesis, therefore obtained by connecting tip-to-tail all the PVs computed at each time bin from the activity recorded during the Iso and Obs tasks in Monkeys 1 and 2. Gray dotted lines indicate mean actual cursor's trajectories. For each force direction, the time series of the PV are shown next to each target, from 60 ms before to 310 ms after the DFT onset, with time increasing in a clockwise direction. The numbers under each plot indicate the mean angular difference between the decoded trajectories and the actual cursor's trajectories averaged over all directions.
