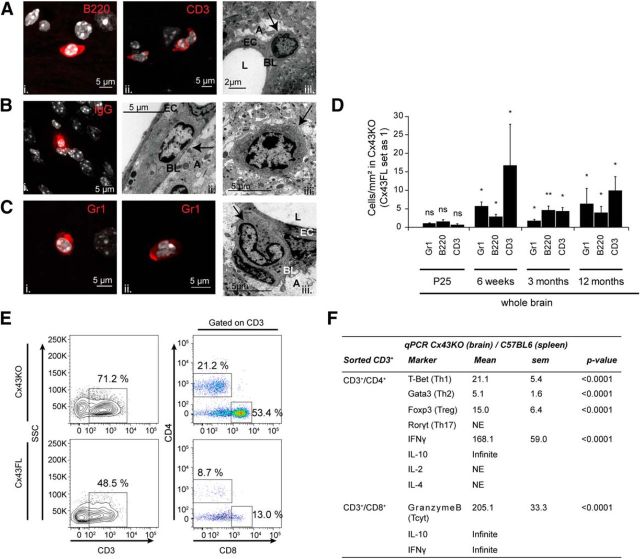
Figure 2.
Immune cells migrate across BBB in the absence of astroglial Cx43. A–C, Representative images of intraparenchymal leukocytes (in red) in Cx43KO at 6 weeks. Nuclei (in gray) are counterstained with Hoechst. Ai, B220+ cell; Aii, CD3+ cells; Aiii, TEM image of a lymphocyte inserted into the perivascular BL. EC, Endothelial cell; A, astrocyte endfeed; L, lumen. Bi, IgG+ cell; Bii, Biii, TEM images of plasma cells located within the perivascular BL (Bii) or the parenchyma (Biii). Ci, Gr1+ macrophage (round nucleus); Cii, Gr1+ neutrophil (multi-lobed nucleus); Ciii, TEM image of a neutrophil inserted into the perivascular BL. D, Quantification of intraparenchymal leukocytes in Cx43KO and Cx43FL (Cx43KO/Cx43FL cell/mm2): Gr1+ cells at P25, 1.2 ± 0.1, p = 0.4, n = 3; at 6 weeks, 5.8 ± 1.1, p = 0.05, n = 3; at 3 months, 1.9 ± 0.5, p = 0.03, n = 6; at 12 months, 6.5 ± 4.3, p = 0.05, n = 3. B220+ cells at P25, 1.7 ± 0.3, p = 0.1, n = 3; at 6 weeks, 3.0 ± 0.5, p = 0.05, n = 3; at 3 months, 4.8 ± 1.1, p = 0.002, n = 6; at 12 months, 4.1 ± 1.8, p = 0.05, n = 3. CD3+ cells at P25, 0.8 ± 0.5, p = 0.9, n = 3; at 6 weeks, 16.9 ± 11.1, p = 0.05, n = 3; at 3 months, 4.5 ± 1.0, p = 0.05, n = 6; at 12 months, 10.1 ± 3.8, p = 0.05, n = 3. Data are presented as means ± SEMs. Mann–Whitney one-tailed test. nsp > 0.05, *p < 0.05, **p < 0.01. Cx43FL values are set as 1. E, FACS analysis of intraparenchymal CD3+ cells in 6-week-old Cx43KO and Cx43FL. Left plots show CD3 sorting in CD11b− cells isolated from the brain. Right plots show CD4 and CD8 sorting in CD3+ cells. SSC, Side scatter. F, qPCR analysis of Cx43KO brain-sorted CD3+/CD4+ and CD3+/CD8+ cells compared with CD3+ C57BL/6 spleen-sorted cells. NE, Not expressed. “Infinite” means that the transcript was amplified only in Cx43KO cells. Data are presented as means ± SEMs. Wilcoxon's signed-rank test, two tailed (n = 3). C57BL/6 spleen values are set as 1.

