Figure 6.
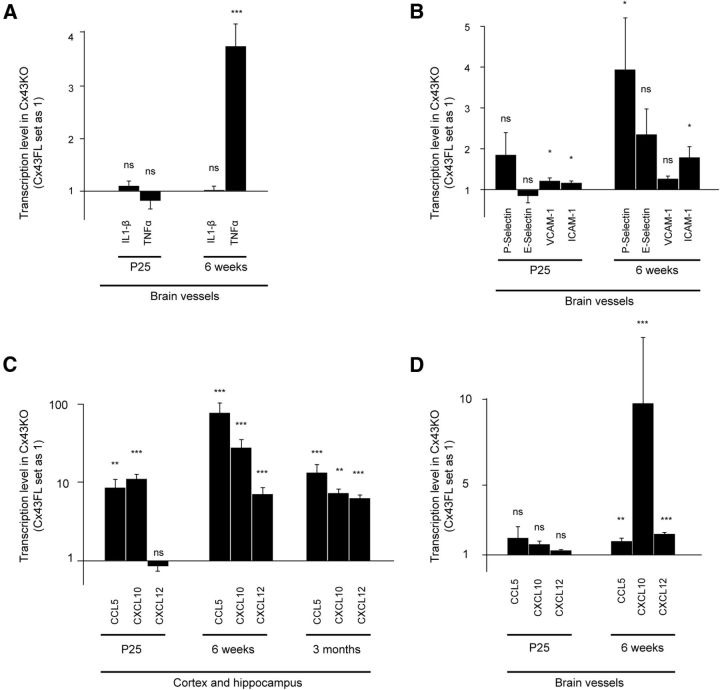
Endothelial activation and chemoattraction in the absence of astroglial Cx43. A, qPCR analysis of inflammatory cytokines on Cx43KO and Cx43FL purified brain vessels. IL-1β at P25, 1.1 ± 0.1, p = 0.2, n = 5; at 6 weeks, 1.03 ± 0.07, p = 0.5, n = 5; TNFα at P25, 0.8 ± 0.1, p = 0.4, n = 5; at 6 weeks, 3.7 ± 0.4, p < 0.0001, n = 5. B, qPCR analysis of endothelial activation markers on Cx43KO and Cx43FL purified brain vessels. P-Selectin at P25, 1.8 ± 0.3, p = 0.07, n = 5; at 6 weeks, 3.9 ± 1.3, p = 0.02, n = 3; E-selectin at P25, 0.9 ± 0.1, p = 0.8, n = 5; at 6 weeks, 2.3 ± 0.6, p = 0.06, n = 5; VCAM-1 at P25, 1.2 ± 0.1, p = 0.02, n = 5; at 6 weeks, 1.3 ± 0.1, p = 0.1, n = 5; ICAM-1 at P25, 1.2 ± 0.0, p = 0.02, n = 5; at 6 weeks, 1.8 ± 0.3, p = 0.01, n = 5. C, qPCR analysis of three of the tested chemokines on Cx43KO and Cx43FL cortex and hippocampus. CCL5 at P25, 8.6 ± 2.5, p = 0.004, n = 4; at 6 weeks, 76.3 ± 26.2, p = 0.0009, n = 4; at 3 months, 13.3 ± 4.0, p = 0.002, n = 6; CXCL10 at P25, 11.4 ± 2.1, p < 0.0001, n = 4; at 6 weeks, 27.4 ± 8.0, p < 0.0001, n = 4; at 3 months, 7.3 ± 0.9, p < 0.0001, n = 6; CXCL12 at P25, 0.9 ± 0.2, p = 0.3, n = 4; at 6 weeks, 7.0 ± 1.8, p = 0.0003, n = 4; at 3 months, 6.3 ± 0.7, p = 0.0002, n = 6. D, qPCR analysis of three of the tested chemokines on Cx43KO and Cx43FL purified brain vessels: CCL5 at P25, 2.0 ± 0.8, p = 0.9, n = 5; at 6 weeks, 1.8 ± 0.2, p = 0.005, n = 5; CXCL10 at P25, 1.6 ± 0.3, p = 0.16, n = 5; at 6 weeks, 9.8 ± 4.0, p < 0.0001, n = 5; CXCL12 at P25, 1.3 ± 0.08, p = 0.05, n = 5; at 6 weeks, 2.2 ± 0.2, p < 0.0001, n = 5. Cx43FL expression levels are set at 1. NE, Not expressed. Data are presented as means ± SEMs. nsp > 0.05, *p < 0.05, **p < 0.01, ***p < 0.001. Mann–Whitney two-tailed test. Cx43FL values are set as 1.

