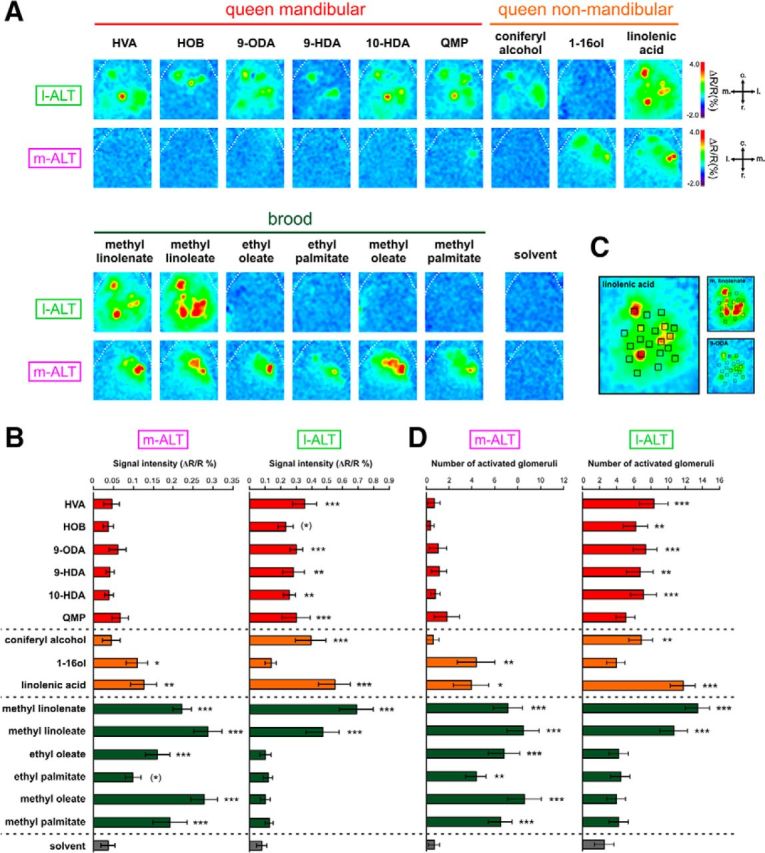
Figure 2.

Responses to queen and brood pheromone compounds in l-ALT and m-ALT PNs. A, Odor-induced calcium activity maps obtained from l-ALT (top) and m-ALT neurons (bottom) in two different animals, to 5 queen mandibular compounds and the QMP mixture, to 3 queen nonmandibular compounds, to 6 compounds of the brood pheromone and to the solvent. Relative fluorescence changes (ΔR/R%) are presented in a false-color code, from dark blue to red. B, Pixelwise analysis. Amplitude of calcium responses (ΔR/R%) in the antennal lobe for m-ALT (n = 9) and l-ALT neurons (n = 10) to queen mandibular compounds (in red), queen nonmandibular compounds (in orange), and brood pheromone compounds (in green). Gray represents the response to the solvent. C, Glomerular analysis. Example of repartition of the 20 glomerulus-sized areas of interest (henceforth “glomeruli”) on a l-ALT recording, showing overlay with 3 odor response maps. D, Number of activated glomeruli in m-ALT (n = 9) and l-ALT neurons (n = 10). Error bars indicate the SEM across animals. Stars on the right of each bar indicate significant difference compared with solvent (Dunnett's test). *p < 0.05; **p < 0.01; ***p < 0.001; (*)p < 0.1.
