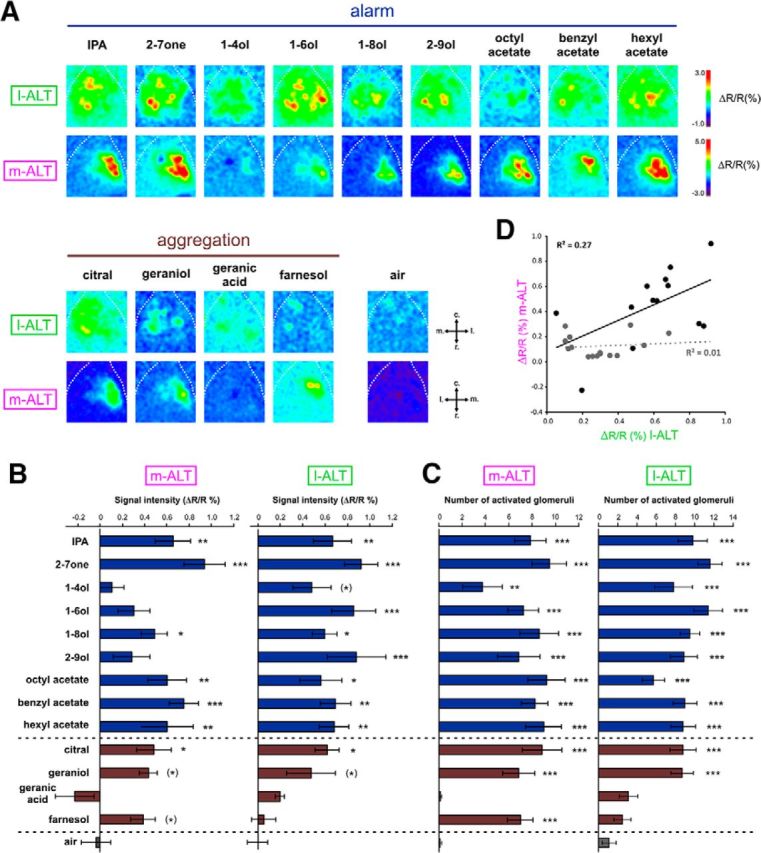
Figure 5.

Responses to alarm and aggregation compounds in l-ALT and m-ALT PNs. A, Odor-induced calcium activity maps obtained from l-ALT (top) and m-ALT neurons (bottom) in different animals to 9 alarm compounds (in blue), 4 aggregation compounds (in brown), and to the control (air). Relative fluorescence changes (ΔR/R%) are presented in a false-color code, from dark blue to red. B, Amplitude of calcium responses (ΔR/R%). C, Numbers of activated glomeruli recorded for l-ALT (n = 10) and in m-ALT neurons (n = 8) to alarm (in blue) and aggregation compounds (in brown). Gray represents responses to the air control. Error bars indicate SEM. D, Correlation between the amplitudes of calcium responses (ΔR/R%) recorded in the l-ALT and m-ALT neurons for alarm and aggregation compounds (black circles and solid line) and for queen mandibular, nonmandibular, and brood compounds (gray circles and dashed line). Dunnett's test: *p < 0.05; **p < 0.01; ***p < 0.001; (*)p < 0.1.
