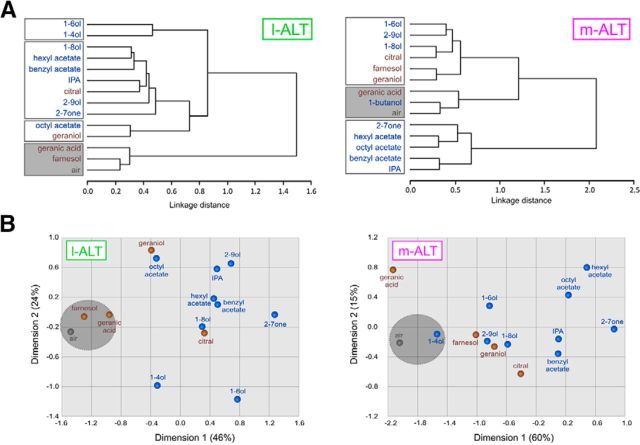
Figure 6.
Coding of alarm and aggregation pheromone compounds in both subsystems. A, Cluster analysis showing similarity relationships among alarm and aggregation compounds (Ward's method), using Euclidian distances obtained for the 91 odor pairs in both subsystems. In both analyses, blue represents alarm compounds, and brown represents aggregation compounds. Gray represents air control. Gray background represents noncoding compounds within each neuron type (Fig. 5B). White background represents the compounds processed within each subsystem. The dendrogram for l-ALT neurons (left) does not show a separation based on the pheromonal nature of the compounds. Rather, short chain alcohols are separated from most other compounds. The cluster analysis for the m-ALT neurons (right) isolates aggregation compounds with the alcohols of the alarm pheromone from the remaining alarm compounds. B, Proximity analysis for both neuron types. For l-ALT neurons (left), the first dimension (46% of variance) separates processed from the nonprocessed compounds. The second dimension (24% of variance) separates acetate esters from short chain alcohols. Proximity analysis for m-ALT neurons (right) defines two main dimensions (75% of variance), which mostly differentiated ester-type from alcohol-type alarm compounds, the latter appearing together with aggregation compounds.

