Figure 3.
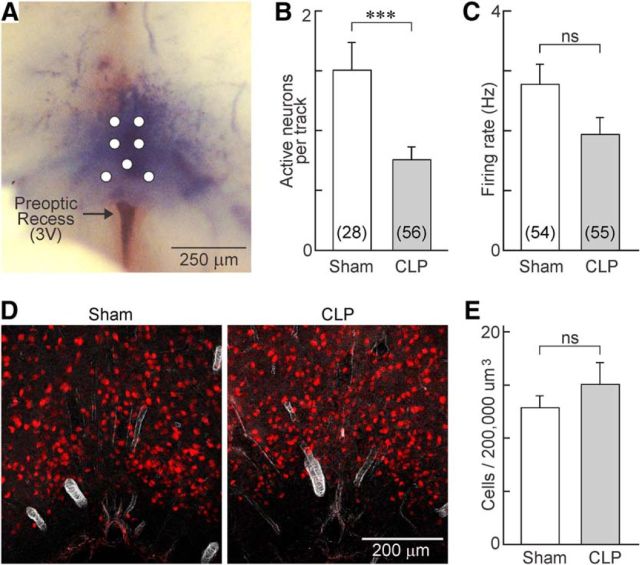
CLP reduces the density of cells showing spontaneous electrical activity but not neuron density in OVLT. A, Whole-mount photograph showing the ventral surface of the brain in a hypothalamic explant prepared from a rat injected intravenously with 1% Evans Blue. Top is rostral, and bottom is caudal. Note that the dye is localized to the parenchyma of the tissue that lies immediately rostral to the anterior edge of the preoptic recess of the third ventricle (3V). The white circles show the positions at which microelectrodes were inserted. B, Bar graphs show the mean ± SEM density of spontaneously active neurons observed in the OVLT of sham and CLP animals (n = 28 tracks/4 rats and n = 56 tracks/8 rats, respectively). C, Bar graphs show the mean ± SEM steady-state firing rate of spontaneously active OVLT neurons in sham (n = 54 neurons/10 rats) and CLP (n = 55 neurons/8 rats) animals. D, Immunofluorescence micrograph showing staining for the neuronal marker NeuN (red) in representative coronal sections through the OVLT of sham (n = 26 sections/3 rats) and CLP (n = 23 sections/3 rats) animals. E, Bar graphs show the mean ± SEM density of NeuN-positive cells counted per unit volume in the OVLT of sham and CLP rats. ***p < 0.005; ns, not significant.

