Figure 3.
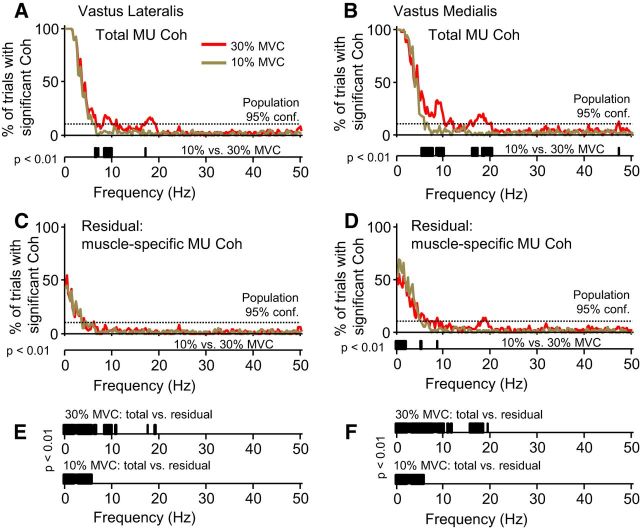
Total within-muscle motor unit coherence and muscle-specific motor unit coherence for the vasti muscles. A and B show the proportion of trials (80 total) in which significant within-muscle motor unit coherence was observed for the vastus lateralis and vastus medialis, respectively. The red traces show results for muscle contractions held at 30% MVC, whereas the brown traces show the results for 10% MVC. The dashed horizontal line indicates the highest proportion that could have been observed simply by chance. Below the x-axis of each plot are the results of a randomization test comparing the coherence values observed at 10% MVC with 30% MVC. The black bars indicate frequencies at which a significant difference existed between coherence magnitudes measured across trials at each force level. The significance level has been set to 0.01 to correct for multiple comparisons and thus allow each bar to represent a frequency bin of 1 Hz. C and D represent the same analysis as in A and B but after removing the effects of cross-muscle drive on within-muscle coherence. Therefore, the residuals shown represent the frequency content of muscle-specific neural drive. E and F show the results of a randomization test comparing the magnitude of total within-muscle coherence to the residual (muscle-specific) coherence at 30% MVC (top) and 10% MVC (bottom). Both muscles show similar profiles of total within-muscle coherence, with the primary component of each occurring below 5 Hz but extending farther to include components near 10 and 20 Hz when force increases from 10% MVC to 30% MVC. The magnitude of coherence <5 Hz appeared not to change with force, in contrast to higher-frequency components that did show force dependence. Muscle-specific coherence was weaker, limited primarily to frequencies <5 Hz, and was not highly dependent on force.

