Figure 2.

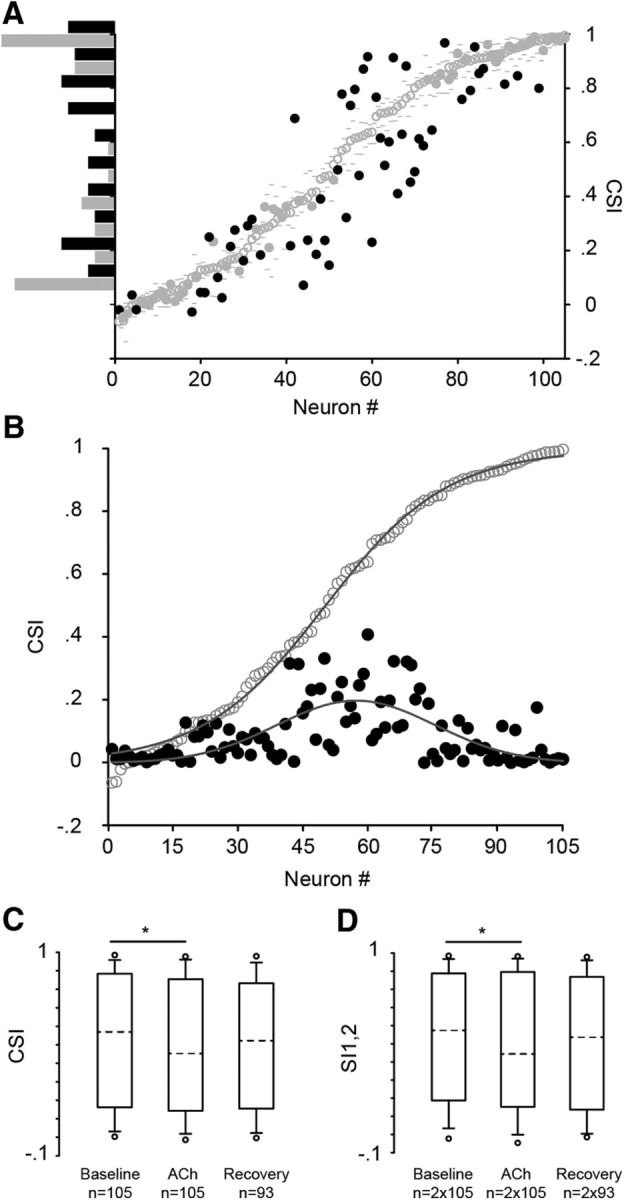
ACh effect on SSA in IC neurons. A, The recorded IC neurons showed different levels of CSI in the baseline condition (open circles) from −0.06 to 0.99. The low and high 95% CI of each baseline CSI are displayed (gray dashes). The CSI of a subset of IC neurons changed during the application of ACh (black circles), being higher or lower than the CIs of the baseline CSI value, whereas another subset of IC neurons (gray circles) was insensitive to ACh application. Most of the neurons insensitive to ACh lacked SSA (CSI, ≤0.1) or exhibited extremely high values (CSI, ≥0.9) in the baseline condition (vertical histogram, left inset). B, The strength of the effect of ACh depended on the baseline CSI. The baseline CSI values (open circles) were fitted by a Sigmoid curve (r2 = 0.99, p < 0.001, gray line), whereas the absolute difference (black circles, expressed in positive values) between the baseline and ACh condition followed a Gaussian curve (r2 = 0.44, p < 0.001, gray line). C, D, Box plots of the CSI (C) and SI1,2 (D) under the baseline, ACh, and recovery conditions. ACh decreased the SSA indices in the population of neurons (Friedman test). The dashed lines within each box represent the median values. The edges of the boxes delimit the 25th and 75th percentiles, the whisker bars extend to the 10th and 90th percentiles, and the circles represent the 95th and 5th percentiles. *p < 0.05.
