Figure 4.

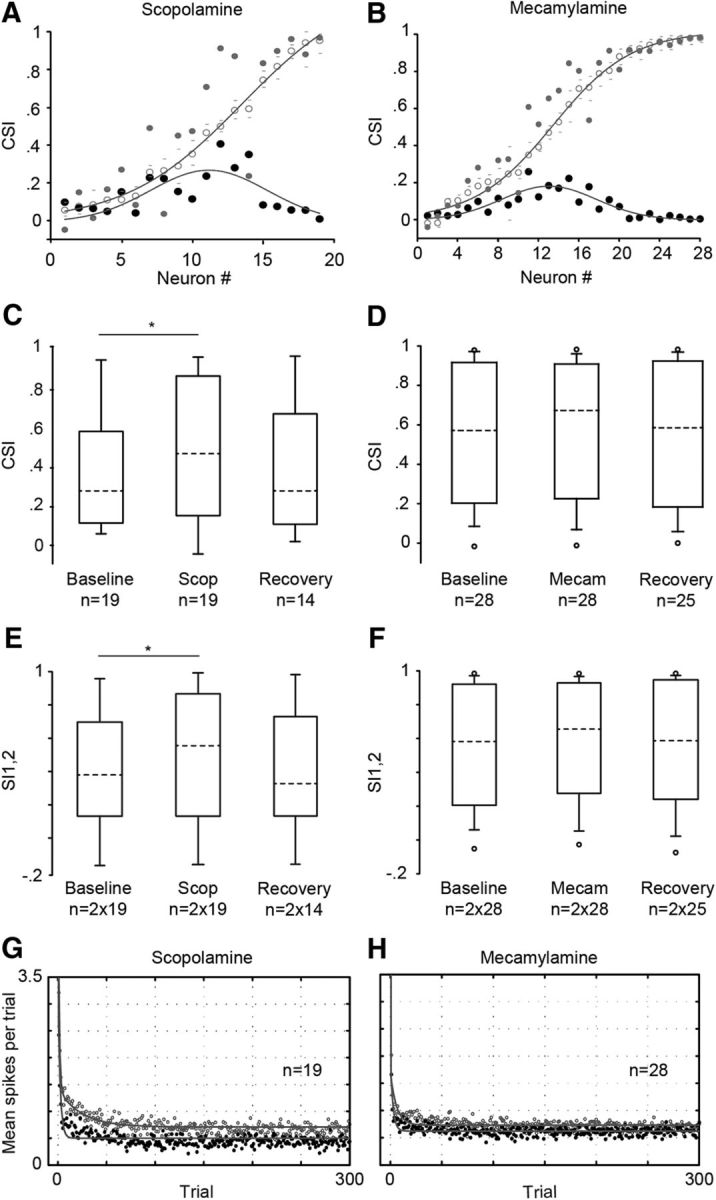
Effects of scopolamine and mecamylamine on SSA. A, The blockade of muscarinic receptors by the application of scopolamine increased the CSI (gray circles) in most of the recorded IC neurons. The baseline CSI values (open circles) were fitted by a Sigmoidal curve (r2 = 0.99, p < 0.001, gray line). The low and high 95% bootstrapped CI values (gray dashes) are displayed for each baseline CSI. Similarly, the absolute differences (expressed in positive values) between the CSI in the baseline and scopolamine condition (black circles) were fitted by a Gaussian curve (r2 = 0.52, p < 0.01, gray line). B, Effect of nicotinic receptor blockade with mecamylamine. The format is the same as in A (Sigmoidal curve, r2 = 0.99; Gaussian curve, r2 = 0.76; p < 0.001). C, Box plot of the population CSI showing that scopolamine (Scop) increased SSA as measured by the CSI (Friedman test). The box plot format is as in Figure 2, C and D. D, Box plot of the population CSI indicating that the mecamylamine (Mecam) application did not affect the SSA (Friedman test). E, Box plot of the frequency-specific SSA index for both frequencies (SI1,2) under the baseline, scopolamine and recovery condition. Scopolamine increased the SI (Friedman test). F, Box plot of the SI1,2 indicating the lack of effect of mecamylamine (Friedman test). G, Mean response to the standard tone for each position (trial) in the oddball sequence in the baseline (open circles) and scopolamine conditions (black circles). The responses were adjusted by a double exponential function (gray lines) with a fast and slow decay component and a steady-state part. Scopolamine decreased only the steady-state component. H, Time course of the response under the baseline (open circles) and mecamylamine conditions (black circles). Mecamylamine did not affect the dynamics of adaptation. The format is the same as in G. *p < 0.05.
