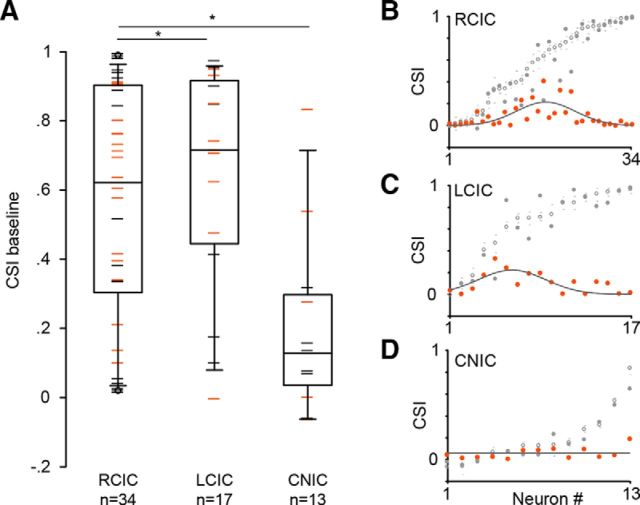
Figure 5.
Anatomical location of the recorded IC neurons. A, Box plot of the baseline CSI values in our sample of IC neurons with recording sites localized in the RCIC, LCIC, and CNIC. The box plot format is as in Figure 2, C and D. Median CSI from the RCIC and LCIC were significantly larger than the CSI from the CNIC (Kruskal–Wallis test). Neurons with CSI values affected (orange dashes) and not affected (black dashes) by ACh are displayed separately. B–D, Effect of ACh on the CSIs of neurons from the RCIC (B), LCIC (C), and CNIC (D). Shown are the baseline CSIs (open circles) with their low and high 95% bootstrapped CI values (gray dashes), CSI values under ACh application (gray circles), and absolute differences (expressed in positive values) between the CSIs under the baseline and ACh conditions (orange circles). The change exerted by ACh on the CSIs of neurons from the RCIC (r2 = 0.47, p < 0.001), LCIC (r2 = 0.47, p < 0.001), and CNIC (r2 = 2.42 × 10⁻¹¹) was fitted by a Gaussian curve (gray lines).*p < 0.05.

