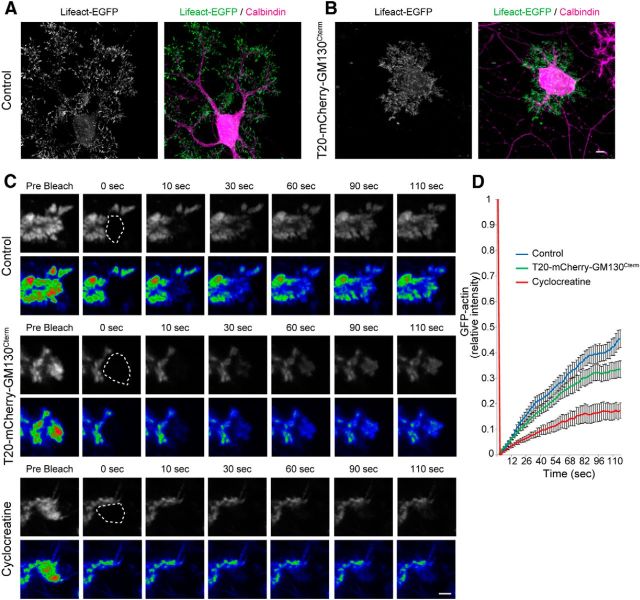
Figure 8.
Altered actin dynamics in dendrites depleted with mitochondria or CK activity. A, B, Purkinje cells were infected with Lifeact-EGFP alone (A) or with T20-mCherry-GM130Cterm (B). Scale bar, 5 μm. C, Reduced actin turnover in the dendrite depleted with local mitochondria or CK activity. Purkinje cells were infected with either GFP-actin alone (control), coinfected with T20-mCherry-GM130Cterm, or treated with 5 mm cyclocreatine at 9–10 DIV. Recovery of GFP-actin at photobleached area (dotted frame) was monitored at 2 s intervals at 10 DIV. Pseudocolors show the intensity of GFP-actin signal. Scale bar, 2 μm. D, Time course of the fluorescence recovery of GFP-actin. Error bars represent SEM, n = 15 for each data point.

