
Figure 4.
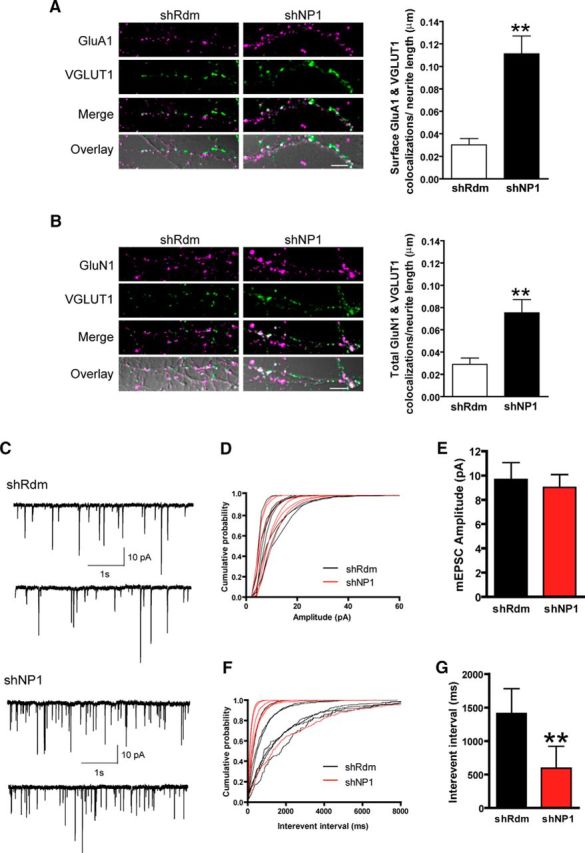
Knockdown of NP1 recruits GluA1 and GluN1 to new excitatory synapses and increases the frequency of excitatory mEPSCs. A, B, Representative confocal images and quantitative analysis of colocalizations of VGLUT1 with surface GluA1 (A) or total GluN1 receptors (B). White indicates colocalization of GluA1 or GluN1 (magenta) and VGLUT1 (green). These are overlaid onto the corresponding DIC image to show sites of colocalization within a neurite. Scale bar, 5 μm. Studies were performed in mature cultured cortical neurons. GluA1 and GluN1 immunostaining were performed in live and fixed neurons, respectively. Values are mean ± SEM of the number of colocalizations per μm of neurite length (29 neurons in each group for GluA1 (A) and 23 neurons in each group for GluN1 (B), from n = 3 independent experiments). C, Representative traces from spontaneous mEPSC recordings from shRdm (top) and NP1-silenced neurons (bottom). Neurons were held at −70 mV and mEPSCs were recorded in the presence of 2 μm TTX, 10 μm picrotoxin, and 10 μm bicuculline. D, Cumulative probability plots of mEPSC amplitude. E, Mean ± SEM of mEPSC amplitude in shRdm (n = 7) and shNP1 (n = 6). F, Cumulative probability plots of mEPSC frequency. G, Mean ± SEM of mEPSC interevent interval in control shRdm (n = 7) and shNP1 knockdown neurons (n = 6; **significantly different from shRdm;, p < 0.01, Student's t test, two-tailed).