
Figure 5.
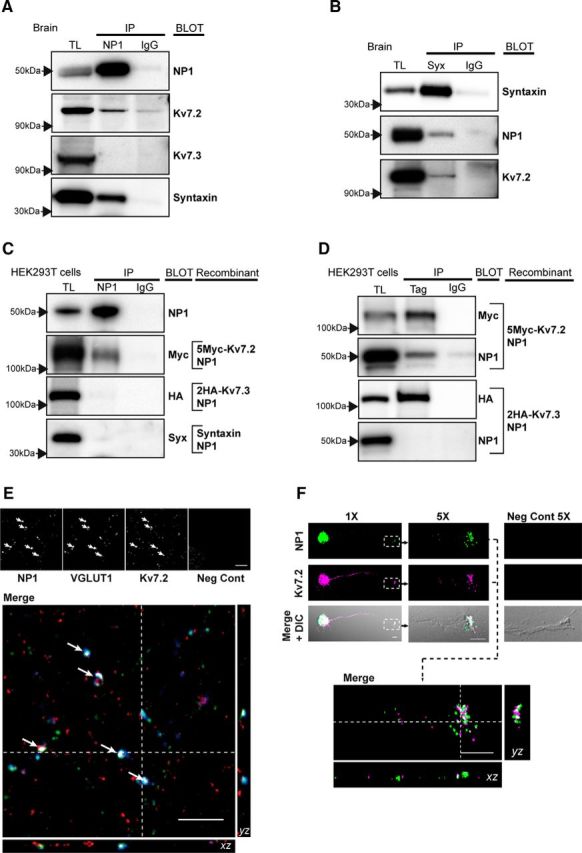
NP1 interacts and colocalizes with Kv7.2 at presynaptic terminals of excitatory synapses and axonal growth cones. A–D, Representative Western blots of immunoprecipitation eluates separated in 6% Tris-Glycine (for high molecular weight proteins) and 4–12% Bis-Tris gels (for low molecular weight proteins). TL, Total protein lysate; Syx, syntaxin. A, Both native Kv7.2 and syntaxin 1A, but not Kv7.3, coprecipitate with NP1 in total brain extracts. B, Both native Kv7.2 and NP1 coprecipitate with syntaxin in total brain extracts. C, D, Recombinant NP1 coprecipitates Kv7.2, but not syntaxin or Kv7.3, in 293T cells transfected with NP1, 5Myc-Kv7.2, 2HA-Kv7.3, and syntaxin 1A cDNAs. Kv7.2 and Kv7.3 were immunoprecipitated with antibodies against their respective Myc and HA tags. E, F, Immunofluorescence studies and confocal microscopy were performed in high-density (E) or low-density (F) isolated cortical neurons. E, Top, Confocal sections of 0.772 μm in the z-plane showing immunofluorescence of NP1, VGLUT1, Kv7.2, and negative control (omitting primary antibodies). Bottom, Colocalization (in white) of the excitatory presynaptic marker VGLUT1 (blue) with NP1 (green) and Kv7.2 (red) is shown in a single section with the corresponding orthogonal views of the stack of confocal sections. White arrows indicate sites of colocalization. F, NP1 (green) and KV7.2 (magenta) immunofluorescence and DIC images of an isolated cortical cultured neuron (1×) with its corresponding axonal growth cone highlighted in a white square box, shown in a confocal section of 0.772 μm in the z-plane at higher (5×) magnification. The negative control for primary antibodies is shown in another growth cone on the right. The image in the bottom is the merge of NP1 and Kv7.2 immunofluorescence images in the single confocal section obtained at 5× showing colocalization (white) of NP1 and Kv7.2 in the growth cone, with the corresponding orthogonal views from its respective stack of confocal sections. Images were acquired using restricted spectral emission wavelength ranges chosen to avoid crosstalk or bleed-through between the three different channels. Scale bar, 5 μm.