Figure 1.
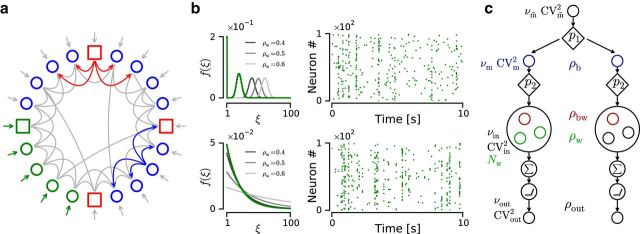
Network diagram and generation of correlated input ensembles. a, Network diagram. Circles/squares represent excitatory/inhibitory neurons. Gray lines indicate recurrent connections. The recurrent connectivity is highlighted for one inhibitory/excitatory neuron (red/blue arrows). Green circles and square represent neurons driven by inputs with predefined within-correlation structure and event train statistics (green arrows). Gray arrows indicate unstructured external inputs. b, Correlation models represent binomial-like (top row) and exponential (bottom row). Parameters: η = 0.2, ρw = 0.2 (green curves), Nw = 100. Grayscale curves represent different ρw values. Subpanels, Amplitude distribution f(ξ) (left column) and example raster plot (right column). All parameters as described in the main text. c, Schematic diagram that illustrates the generation of two correlated input ensembles using the copying algorithm. Small circles represent individual event/spike trains. Tilted squares represent nodes that copy each incoming event/spike with a certain probability pi, where i indicates the step index in the algorithm. LIF neurons are represented as the combination of an integrating (circle enclosing a sum symbol) and a linear-rectifying (circle enclosing a depiction of a threshold-linear transfer function) operation. ρb, Average pairwise correlation between event trains (blue circles); ρbw, average correlation between pairs of spike trains across input ensembles; ρw, average correlation between pairs of spike trains from the same input ensemble (small circles inside larger ones); Nw, number of spike trains in each input ensemble; ν, average event/spike rate; CV2, average coefficient of variation squared of the ISI/IEI distribution.

