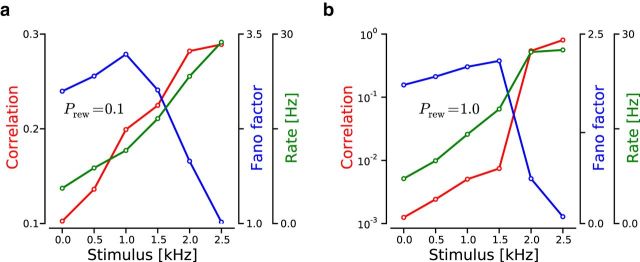
Figure 2.
Evoked dynamics resulting from a firing rate increase in the feedforward inputs projecting to a local region of the network. a, Evoked dynamics in a LCRN with probability of rewiring Prew = 0.1 as a function of the stimulus firing rate. Red trace represents average pairwise spike count correlation coefficient (ρout). Blue trace represents average FF. Green trace represents average output firing rate (νout). b, Evoked dynamics in a purely random network (Prew = 1). The structure of this panel is the same as in a.

