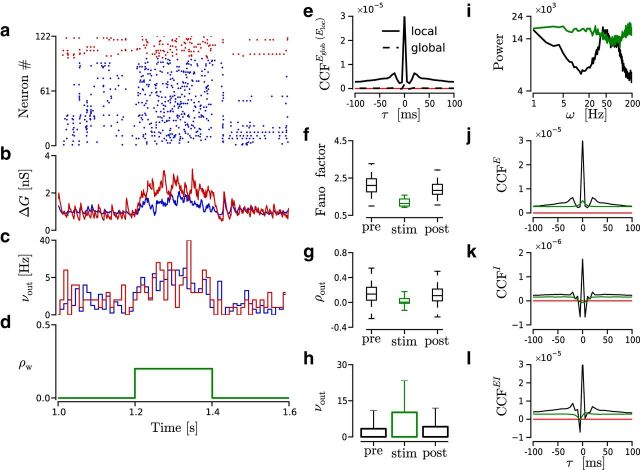
Figure 3.
Transition between ongoing and evoked dynamics reproduced by a transient modification of ρw in the source of feedforward inputs projecting to a local region of the network. a–d, Time evolution of the spiking activity in an example simulation. ρw = 0.2 from 1.2 to 1.4 s and 0 otherwise. Other parameters are as follows: Nw = 1500, ρb = 0, CVm2 = 1, and νtotal = 5 kHz. Red represents I neurons. Blue represents E neurons. a, Raster plot. b, Average conductance change (ΔG) across E neurons. Blue/red trace represents excitatory/inhibitory conductance. c, νout histogram computed with time bin of 10 ms. d, ρw value. e–h, Spiking statistics computed from 500 trials like the one shown in a–d. Pre/stim/post, Time window of 200 ms before/during/after stimulus presentation. e, Average spike count CCFs across pairs of neurons from 100 nearby cells (local); and 10,000 pairs chosen randomly from the entire network (global) (single simulation of 100 s). Count bin, 5 ms. Red line indicates CCF = 0. f, FF distribution across local E neurons. g, ρout distribution of trial spike counts across 10,000 neuron pairs. h, νout across trials and across neurons. i, Power spectrum (see Materials and Methods) of the E population spiking activity during evoked/ongoing (green/black) states. j–l, Average spike count CCFs across pairs of neurons computed during evoked (green) and ongoing (black) states (single simulation of 100 s). Simulation parameters as before. Count bin, 5 ms. Red line indicates CCF = 0. The x-axis is shared across all panels. j, CCFE across 100 nearby E neurons. k, CCFI across 25 nearby I neurons. l, CCFEI across 600 pairs of E and I from a local region of the network.

