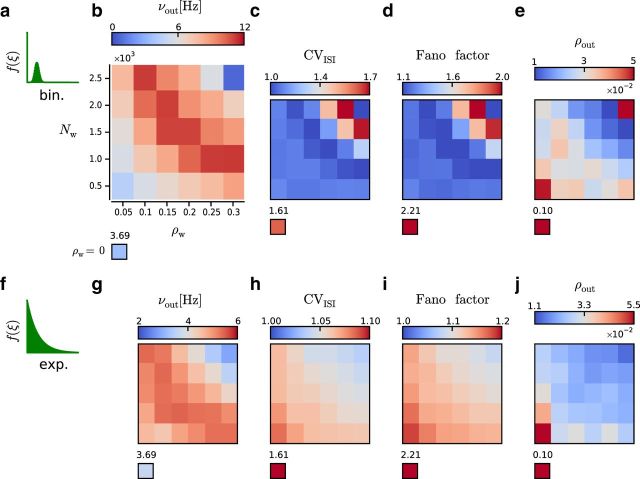
Figure 4.
Average spiking activity in a local region of the network during stimulation with different values of Nw and ρw. The x-axis and y-axis, as indicated in b, are preserved across all panels (c–e,g–j). Stand-alone boxes represent values measured in the absence of stimulation with correlated inputs (i.e., ρw = 0). Constant parameters across simulations: ρb = 0, CVm2 = 1, νtotal = 5 kHz, and η = 0.2. a–e, Input correlations were generated according to the binomial model. a, Binomial-like model of HoCs. b, Average individual firing rate νout in Hz. c, Average CVout2. d, Average FF. e, Average pairwise spike count correlation coefficient (ρout). f–j, Input correlations were generated according to the exponential model. f, Exponential model of HoCs. g–j, Same as in top row.

