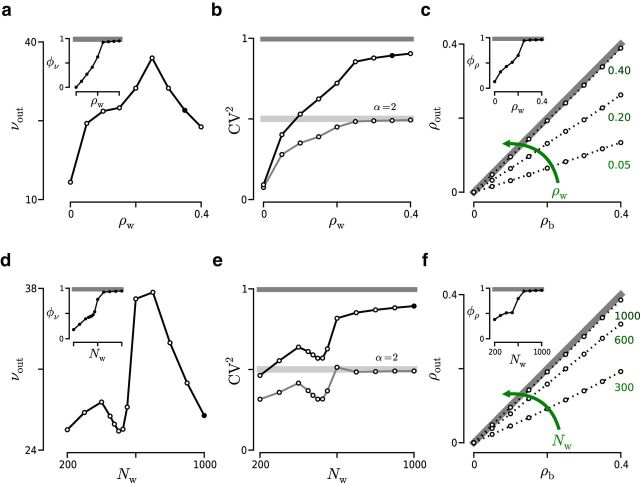
Figure 5.
Effect of ρw and Nw on the spiking activity of two LIF neurons using a binomial correlation model. a–c, Effect of ρw (Nw = 1000 inputs; νtotal = 10 kHz) on νout (a), CVout2 (b), and ρout (c). a, νout measured in Hz. Black marker represents the same result as black marker in d. Inset, φν calculated from the same simulations as in main panel. b, Gray horizontal lines indicate CVm2 (dark gray represents Poisson; light gray represents gamma with α = 0.2 and ρb = 0). Black marker represents same result as black marker in e. c, Dotted lines indicate results with different ρw values indicated by the green numbers. Gray line indicates ρb = ρout. Inset, φρ = 〈ρout/ρb〉ρb, where 〈·〉ρb indicates average across ρb. d–f, Effect of Nw on the spiking activity (ρw = 0.35; νtotal = 10 kHz). All the elements are analogous to those in a–c.

