Figure 7.
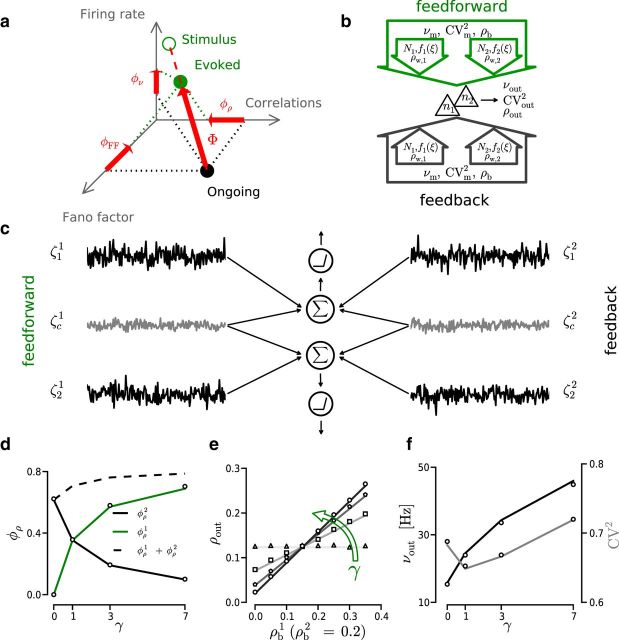
Model of evoked activity with two input sources. a, 3D representation of the network activity as it shifts from ongoing state (black circle) to the evoked state (green filled circle). Green empty circle represents stimulus statistics. Dashed red line indicates direction of the jump. Large red arrow indicates jump magnitude (Φ). Small red arrows indicate magnitude of the transformation projected onto the respective axis (φρ, φν, φCV). b, Schematic diagram illustrating the concept of two different input sources: feedback and feedforward. Each source has its own event train statistics (νm, ρb, CVm2) and within-correlation structure (Nw, ρw, f(ξ)). c, Two LIF neurons (represented as in Fig. 1c) each receiving two independent currents with Gaussian statistics (black and gray traces). Gray traces represent shared currents ζci where i = 1,2 denotes source index. Black traces represent independent currents ζji, where j = 1,2 is the neuron index and i as before. d–f, White markers represent results from simulations. Solid traces represent analytical approximation. d, Correlation susceptibility φρ as a function of the variance ratio γ. Black/green trace represents φρ associated with ongoing/stimulus input source. e, Effect of γ on the output correlations (ρout) for different values of ρb1 and a fixed value of ρb2 = 0.2. Green arrow indicates direction of γ increase. f, Effect of γ on νout (black) and CVout2 (gray).

