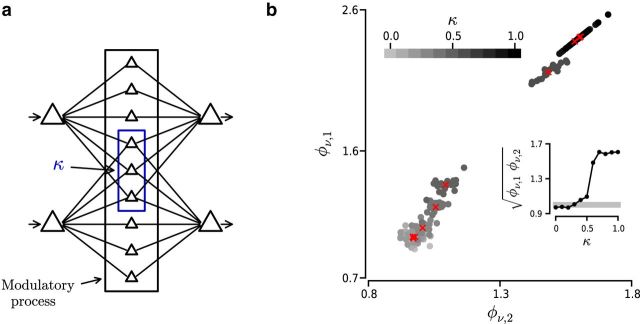
Figure 8.
Effect of shared inputs on the transmission of firing rates. a, Schematic diagram representing the transmission of spiking activity across three layers of cortical neurons. Blue rectangle represents neurons projecting to both neurons in the third layer. κ indicates fraction of shared inputs. Black rectangle represents target neurons of a hypothetical regulatory process (e.g., attention) altering ρw and/or Nw of inputs to the third layer. b, φν as a function of the fraction of shared inputs (κ) of two neurons in the third layer (see a; ρw = 0.2 and Nw = 1000). Grayscale dots indicate φν values computed for each trial. Grayscale represents fraction of shared inputs κ (see color bar on top). Red crosses represent average across trials for each condition. Inset, Geometric mean across neurons of mean φν values shown in the main panel.

