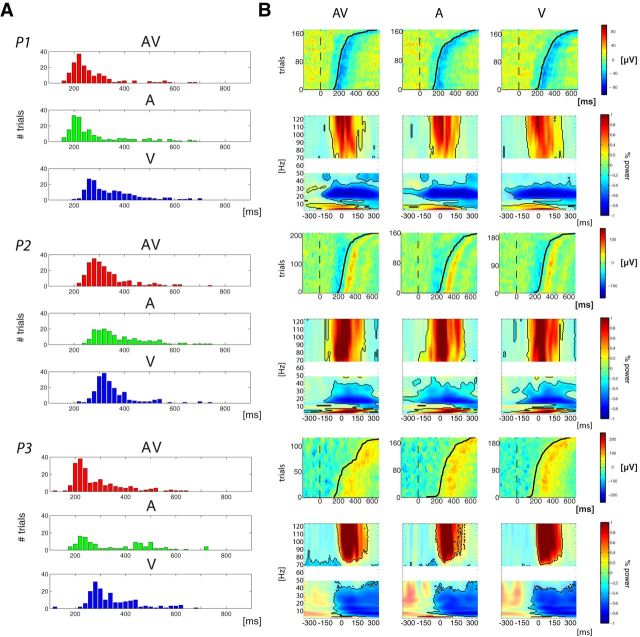
Figure 3.
Behavior and motor-related activations. A, For each participant RT distribution is plotted. Bars represent the amount of trials with RTs included in a 20 ms bin. Red, green, and blue correspond, respectively, to audiovisual, auditory-alone, and visual-alone conditions. B, Motor-related activity in response to AV (left), A (middle), and V (right) stimuli. For each subject the first row depicts single-trial representations of activity, in microvolts, recorded over motor cortex, from −100 to 700 ms. Single trials were sorted per RT (represented by the black line). The second row represents induced power modulation (relative to the entire period) time locked to the response, from −350 to 350 ms, for frequencies ranging from 3 to 50 and 70 to 125 Hz. Corrected significant values are depicted with solid colors and black contours.

