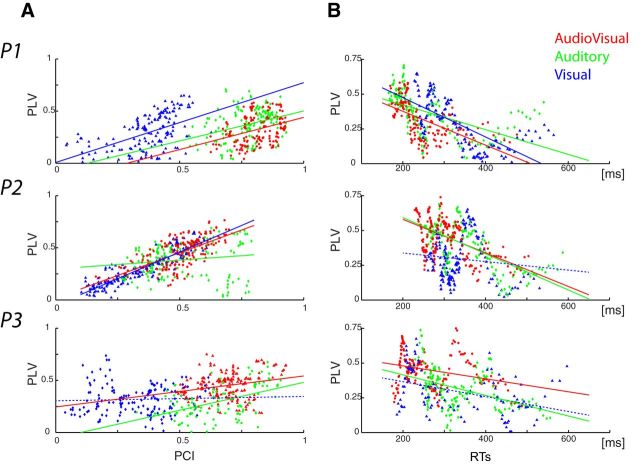
Figure 6.
Relationship between phase alignment in auditory cortex, phase locking between auditory and motor cortices, and response times (each row represents a participant). A, Correlation between PCI and PLV. B, Correlation between PLV and RTs. Each point on the x-axis of the scatter plots represents the estimated phase alignment index and/or corresponding RTs for 10% of the trials, binned per RT (audiovisual in red, auditory-alone in green, visual-alone in blue). Fitting lines are plotted plain if statistics on the slopes were significant and/or at trend, dashed otherwise.

