Figure 2.

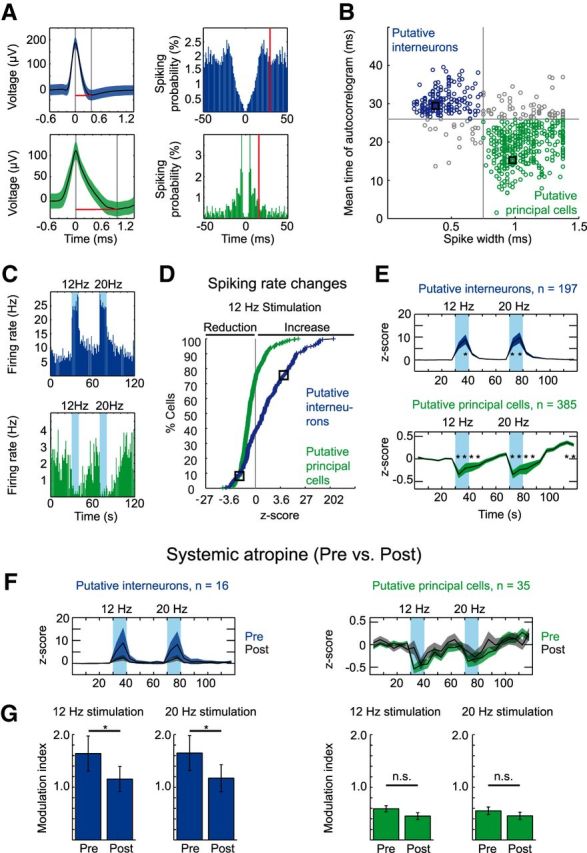
Stimulation of ChAT+ MSDB neurons results in a net increase of interneuron firing and a net decrease of principal cell firing in the hippocampal CA3 subfield. A, Waveform (mean ± SD) and spike autocorrelogram of a putative interneuron (top) and a putative principal cell (bottom) recorded in area CA3 of the dorsal hippocampus. Red lines in left panels indicate the spike width, red lines in right panels indicate the mean time of the autocorrelogram. B, Clustering of cells into putative interneurons or putative principal cells based on the spike width and the first moment (mean time) of the autocorrelogram, black squares mark the cells in A. Single units were recorded from a total of 42 mice during 3–10 trials per mouse: 197 units from 36 mice were clustered as putative interneurons, and 385 units from 39 mice were clustered as putative principal cells. C, Firing rate histograms of the putative interneuron (top) and principal cell (bottom) shown in A. Blue background indicates 10 s time intervals of light stimulation of cholinergic MSDB neurons at 12 or 20 Hz. D, Cumulative cell density plot of firing rate z-scores calculated for the 10 s 12 Hz stimulation duration. Black squares mark cells in A and C. E, Mean (indicated by black line) ± SEM (indicated by colored area) of firing rate z-scores for putative interneurons (top) and putative principal cells (bottom). z-scores were calculated for 5 s time intervals. Firing rate z-scores increased for putative interneurons during 12 and 20 Hz light stimulation, whereas putative principal cells showed a prolonged decrease of firing rate z-scores during and after light stimulation at 12 and 20 Hz. Blue backgrounds indicate time intervals of light stimulation (*p < 0.05 for the difference of an individual 5 s time interval from each 5 s time interval of the baseline period, Kruskal–Wallis one-way ANOVA followed by Tukey–Kramer post hoc test). F, Mean ± SEM of firing rate z-scores for putative interneurons (left) and principal cells (right) before (black line and colored area indicate mean and SEM, respectively) and after (black line and gray area indicate mean and SEM, respectively) systemic atropine application (50 mg/kg body weight, i.p.) to 6 of 42 mice. G, Data represent mean ± SEM of modulation indices (see Materials and Methods) for putative interneurons (blue, left) and putative principal cells (green, right) preapplication and postapplication of systemic atropine for stimulation trains at 12 and 20 Hz (*p < 0.05 for difference in modulation index after systemic atropine application, Wilcoxon signed-rank test). F, G, Sixteen putative interneurons from six mice and 35 putative principal cells from five mice.
