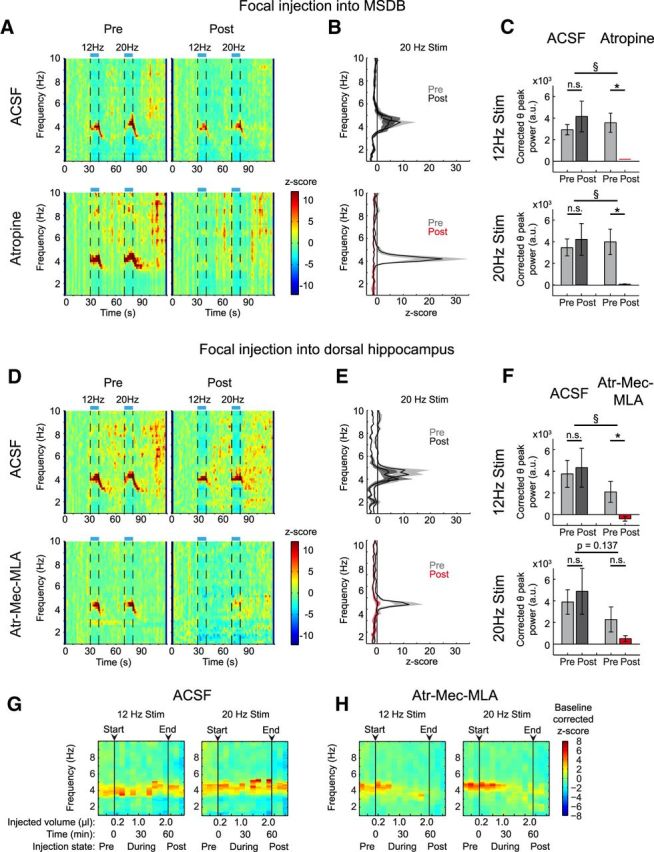
Figure 3.

Hippocampal theta rhythm induced by stimulation of cholinergic MSDB neurons requires an intraseptal relay. A, Time-frequency plots of power spectral density z-scores from LFPs recorded in hippocampal subfield CA1 during light stimulation of cholinergic MSDB neurons for 10 s intervals at 12 or 20 Hz. Top, Animal before and after focal ACSF injection. Bottom, Same prefocal and postfocal MSDB injections of atropine (7.2 mm) in a different animal. z-scores were averaged across trials. B, Mean ± SEM of power spectral density z-scores averaged across the 20 Hz stimulation time interval (72.5–80 s of recording) for preapplication and postapplication conditions [n = 6 mice for ACSF injections (top), and n = 5 mice for atropine injection (bottom)]. C, Mean ± SEM of the corrected theta peak power difference for 12 Hz stimulation (top) or 20 Hz stimulation (bottom) for the ACSF- and atropine-injected groups. Stimulation-induced theta synchronization is abolished after focal atropine injection into the MSDB (*p < 0.05, paired t test. § p < 0.05, t test, n.s.= not significant, same mice as in B, 3–6 and 4–6 trials for pre- and post-ACSF injection condition per mouse, respectively, and 5–7 and 4–5 trials for preatropine and postatropine injection condition per mouse, respectively). D, Time-frequency analysis of hippocampal power spectral density before and after focal injections into the dorsal hippocampus. One animal shown for ACSF (top) and one for a blocker mixture of Mec, 10 mm, MLA, 20 μm, and atropine (Atr), 7.2 mm (bottom). E, Mean ± SEM of power spectral density z-scores averaged over the 20 Hz stimulation time window (72.5–80 s of recording) before and after drug application [n = 3 mice for ACSF injections (top), n = 5 mice for Atr-Mec-MLA injections (bottom)]. F, Mean ± SEM of the corrected theta peak power difference for 12 Hz stimulation (top) or 20 Hz stimulation (bottom) for the ACSF- and blocker-injected groups (statistics as in C, same mice as in E, 6 and 9–10 trials per pre- and post-ACSF injection condition per mouse, respectively, and 3–7 and 5–10 trials per pre- and post-Atr-Mec-MLA injection condition per mouse, respectively). G, H, Change of the stimulation-induced theta oscillations by incremental hippocampal injections of ACSF (G) versus Atr-Mec-MLA (H). Baseline corrected mean z-scores reflect the change of power spectral density upon 12 Hz or 20 Hz stimulation (left or right, respectively) for the 5 animals with cholinergic blocker injections and the 3 ACSF-injected mice (see Materials and Methods for calculation of z-scores). Arrowheads mark the start and end of the microinjection series. During the injection series, one trial was recorded immediately after each of the 10 200 nl microinjections (every 5–6 min).
