Figure 4.

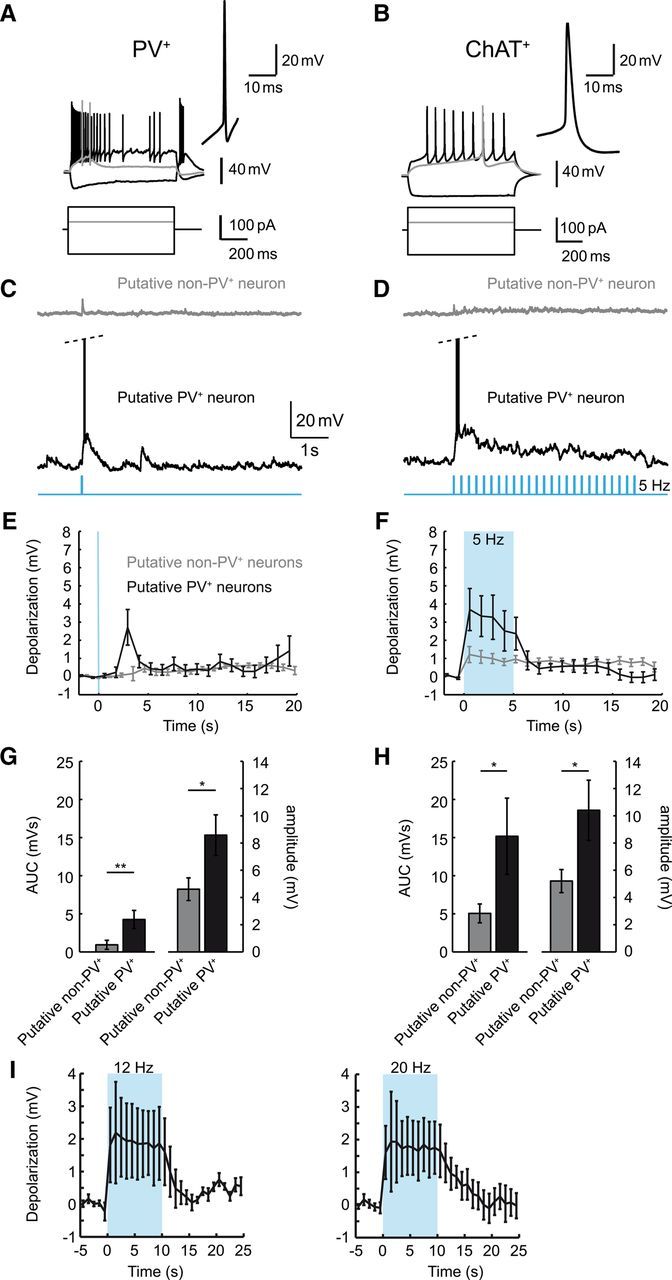
Cholinergic MSDB neurons activate putative PV+ neurons. A, B, Representative recordings from genetically identified PV+ (A) and ChAT+ neurons (B) in the slice preparation. Top and bottom traces correspond to voltage recordings and current injections, respectively. Gray traces correspond to threshold current injections. Insets show the first action potential generated within 50 ms of onset of the current injection and depict the typical properties of these two cell types (see also Table 1). C, D, Representative recordings from putative PV+ and non-PV+ MSDB neurons (single stimulation in C, 5 s stimulation train at 5 Hz in D) during optogenetic activation of cholinergic neurons in MSDB slices. E, F, Quantification of the average depolarization after stimulation. Average voltage in 1 s time bins is plotted. Blue background indicates period of light stimulation (single stimulation and 5 Hz train in E, F, respectively). G, H, The area under the curve (AUC, left y-axis) and average peak amplitude (right y-axis) of the light-evoked depolarizations within 5 s evoked by single stimulations (G, *p < 0.05, **p < 0.01, t test, n = 9 and 19 for putative PV+ and non-PV+ neurons, respectively) or trains (H, *p < 0.05, n = 10 and 16 for putative PV+ and non-PV+ neurons, respectively). I, Light-evoked depolarizations lasted over the full 10 s time interval of the stimulus train used in the in vivo experiments. Left and right are data for stimulus trains at 12 and 20 Hz, respectively. Data are presented as mean ± SEM of four (out of five) recorded cells showing an initial depolarization.
