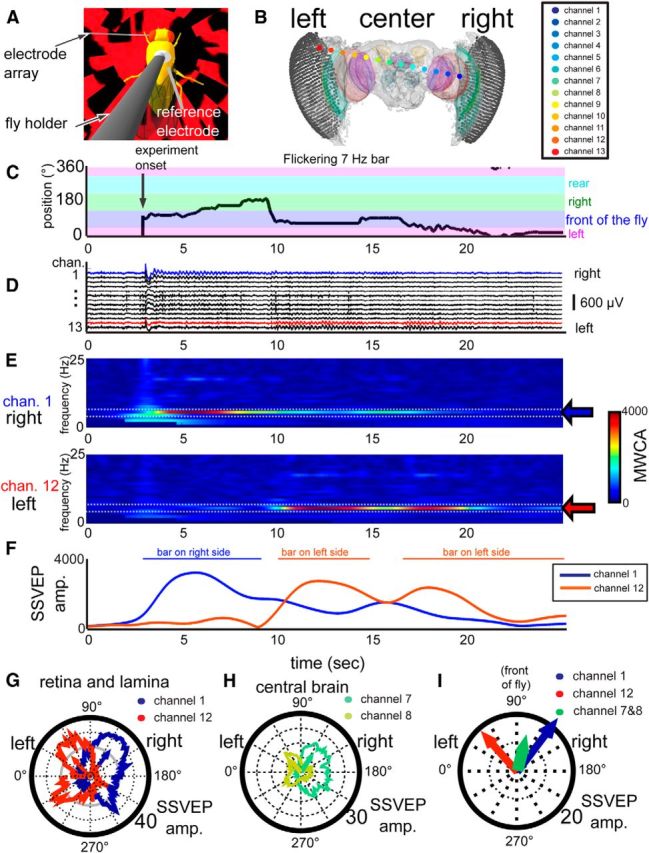
Figure 2.

Multichannel recording in the fly brain reveal bar location during behavior. A, A close-up representation of a tethered fly walking on an air-supported ball with an electrode array inserted. B, A 3D model representation of the electrode array inserted into the head of the fly. C, An example trace of the bar position controlled by a fly walking on a ball with an electrode array inserted. D, The flickering bar can be detected in the brain as oscillations in the LFP across channels which can be mapped to specific neural structures (colored dots in B). E, These oscillations can be detected by measuring the MWCA over time, as represented in these spectrograms of channels 1 and 12 during the same time period represented in C, D. F, The MWCA value for the flicker frequency at 7 Hz (called the SSVEP) can be represented for each channel over time (left and right eye channels are shown, in blue and red). In this case, as the bar moves from left to right, the SSVEP amplitude in the left eye decreases and the SSVEP in the right eye increases. G–I, Mapping the SSVEP amplitude onto the bar position results in an average distribution of flicker responses around the fly. Individual channels in the same fly brain have visual flicker responses which can be mapped to the bar position. Each line represents the mean SSVEP per position and the arrows are the mean direction of the polar plot data. Peripheral brain channels, as in the lamina or retina, have more lateral and larger receptive fields (G) than central brain channels (H). I, The SSVEP mean vectors of the left and right eyes (red and blue arrows) were directed left and right, respectively, whereas the central brain channels (green arrow) pointed in front of the fly.
