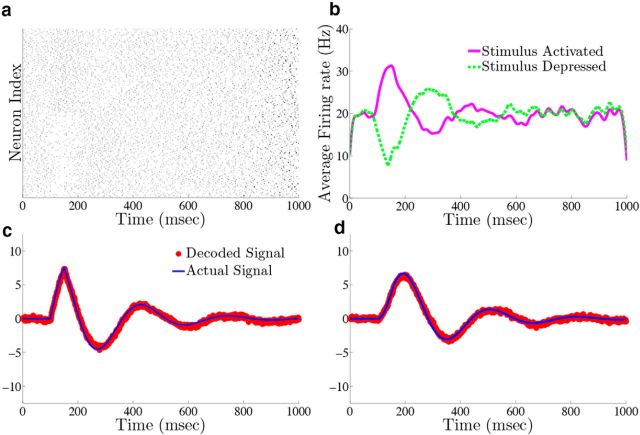
Figure 14.
Damped harmonic oscillations. We show the results of the network processing the box function input via damped harmonic oscillations. All parameters are the same as in Figure 4 except that Γ is now a 2 × N matrix and c(t) is a vector with c1(t) being the same box function from Figure 4a and c2(t) = 0. The elements of Γ are chosen randomly with Γij ∈ Unif(0.002, 1) for i = 1, 2 and j = 1,2,…,N/2 and Γij ∈ Unif(− 1, − 0.002) for i = 1, 2 and j = N/2 + 1,…,N. Also, the columns of Γ are normalized so that ‖Γ‖j = = 0.06. a, The raster plot of the 400 cells in the network. The top 200 rows are the stimulus-activated population, whereas the bottom 200 rows are the stimulus-depressed population. b, Plots the average firing rates for the stimulus-activated (magenta) and stimulus-depressed (green) populations. c, d, Plots of the network estimates (red) against the actual signals (blue).

