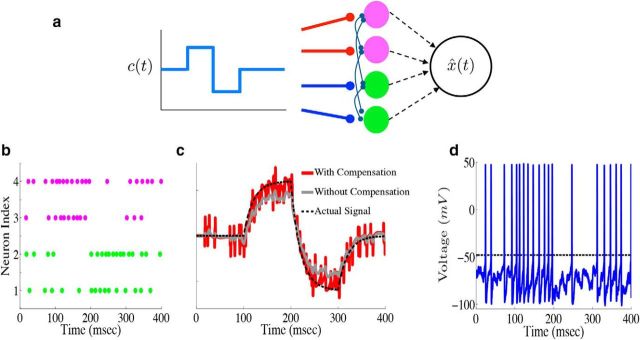
Figure 3.
Leaky integration with a network of biophysical neurons. a, Diagram of an example network of N = 4 cells performing leaky integration. In the network, the upper two cells (magenta) are excited by positive stimulus input (indicated by the red lines), whereas the bottom two cells (green) are depressed (indicated by the blue lines). Each neuron receives the stimulus input as well as synaptic input from every other neuron in the network. The spike trains of all four neurons are used in generating the network estimate x̂(t). b, Raster plot from the example network of four neurons. The input to the network in this case is a simple box function, with a fixed positive value from 100 to 200 ms and a fixed negative value from 200 to 300 ms. c, Network estimate x̂(t) (red trace) plotted against the actual signal x(t) (black dashed trace). The gray trace shows the estimate obtained if the compensating kernel was not included in the network dynamics. d, Voltage trace for the topmost neuron in the example network (top row of the raster plot in b).

