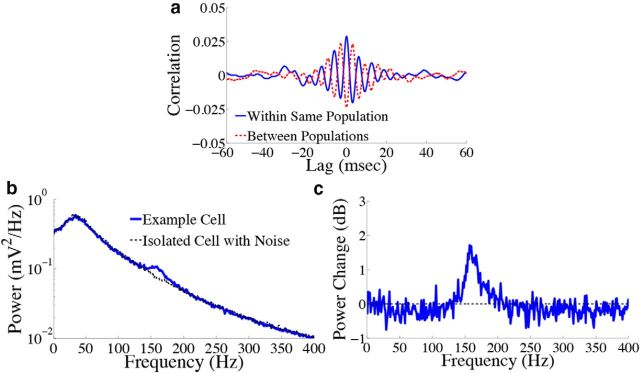
Figure 7.
Error signal affects the correlation of the subthreshold voltage activity in the homogeneous integrator network with the box function input. a, Trial averaged cross-correlation between the subthreshold voltage activity of two cells in the stimulus-depressed population (blue solid trace) and two cells in different populations (red dashed trace). Cells in the same population (different populations) show correlated (anticorrelated) voltage activity over short time lags. b, Trial averaged voltage power spectrum for an example neuron in the stimulus-depressed population (blue solid trace) and for an isolated cell with only background noise input (dashed trace). c, Change in power (expressed in decibels) that occurs when synaptic connections are included (logarithm base 10 of the solid trace in b divided by the dashed trace). Recurrent inputs contribute to the peak in power ∼150 Hz.

