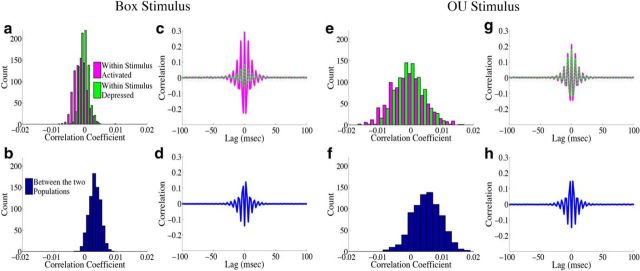
Figure 8.
Structure of spike time correlations for the homogeneous integrator network. The structure of spike time correlations for the network with the box function input are shown in a–d, whereas e–h show the structure of the network with the OU input. a, e, A histogram of the population averaged pairwise correlation coefficient between cells in the stimulus activated population (magenta) and between cells in the stimulus-depressed population (green). In a, the mean correlation coefficient across trials for the stimulus-activated (stimulus-depressed) population is −1.3 × 10⁻³ (−0.3 × 10⁻³), whereas in e it is −1.0 × 10⁻³ (−0.7 × 10⁻³). b, f, A histogram of the average correlation coefficient between cells in the two different populations. In b, the mean correlation coefficient across trials is 3.3 × 10⁻³, whereas in f it is 5.0 × 10⁻³. c, g, Plot of the population and trial averaged shift-predictor-corrected cross correlograms for the raw spike trains of neurons within the stimulus activated (magenta) and stimulus-depressed (green) populations. d, h, Plot of the population and trial averaged shift-predictor-corrected cross correlograms for the raw spike trains of neurons in the two different populations.

