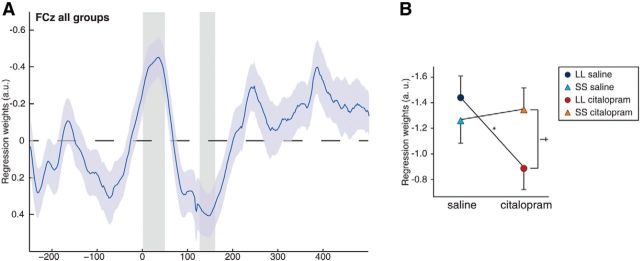
Figure 4.
Relationship between ERN, error positivity, and PES via multiple robust regression. A, During the time window of the ERN, a significant negative covariation between single-trial EEG in error trials and their respective following RT was observed, indicating more slowing when ERN amplitudes were higher (cluster-based permutation test, p = 0.0046). The opposite pattern is seen in the time window of the error positivity (p = 0.027) in which slowing increases when amplitudes become more positive. Data here are collapsed over drug conditions, and gray areas mark significant time windows with p < 0.01 uncorrected. B, A significant decrease in the covariation between single-trial ERN and consecutive slowing was seen for LL (p = 0.009) but not SS (p = 0.638) subjects when comparing saline and drug condition. Shaded plots and error bars reflect SEM.

