
Figure 11.
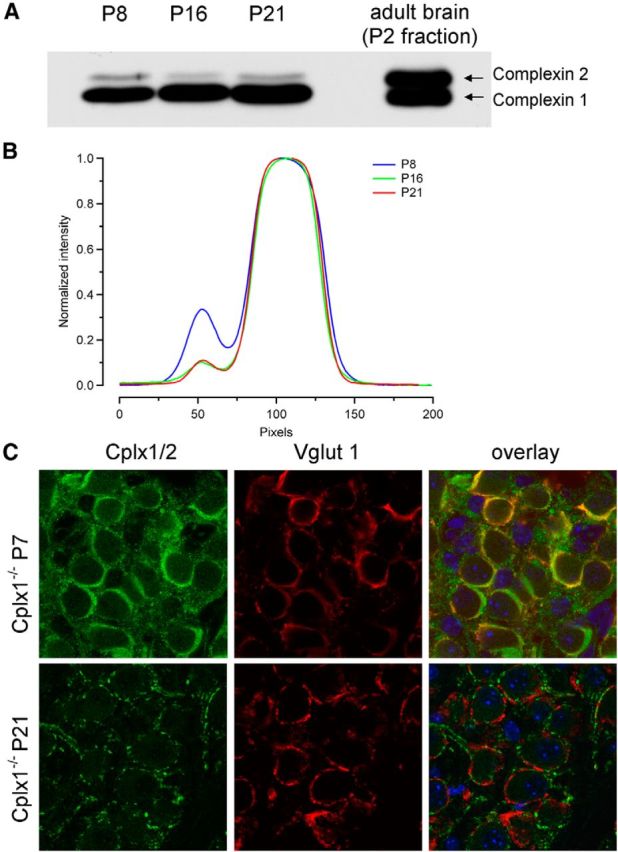
Developmental downregulation of Cplx2 expression in calyx terminals. A, Westernblot analysis of developmental changes in Cplx1/2 expression. Brain homogenates obtained from dissected MNTB regions of P8, P16, and P21 wt mice (10 μg protein per lane) were analyzed by SDS-PAGE and immunoblotting using an anti-Cplx1/2 antibody. Positions of Cplx1 and Cplx2 protein are indicated. B, Intensity profiles obtained from the blot shown in A. Note the decrease in relative contribution of the Cplx2 isoform to the total complexin expression. Different exposure times were used for the analysis to account for the changes in absolute Cplx expression levels from P8 to P21. C, Immunofluorescence images representing confocal sections of MNTB regions of Cplx1−/− mice costained with an anti-Cplx1/2 (green, left) and anti-Vglut1 (red, middle) antibody at P7 (top row) and P21 (bottom row). Right columns show the corresponding overlays. Note the overlap of the Cplx2 fluorescence with that of Vglut1 at P7 (orange) but not at P21, indicating undetectable expression of Cplx2 in calyx terminals of the latter age. The Cplx2-positive puncta that were not costained with Vglut1 presumably represent Cplx2-expressing inhibitory synapses.