
Figure 3.
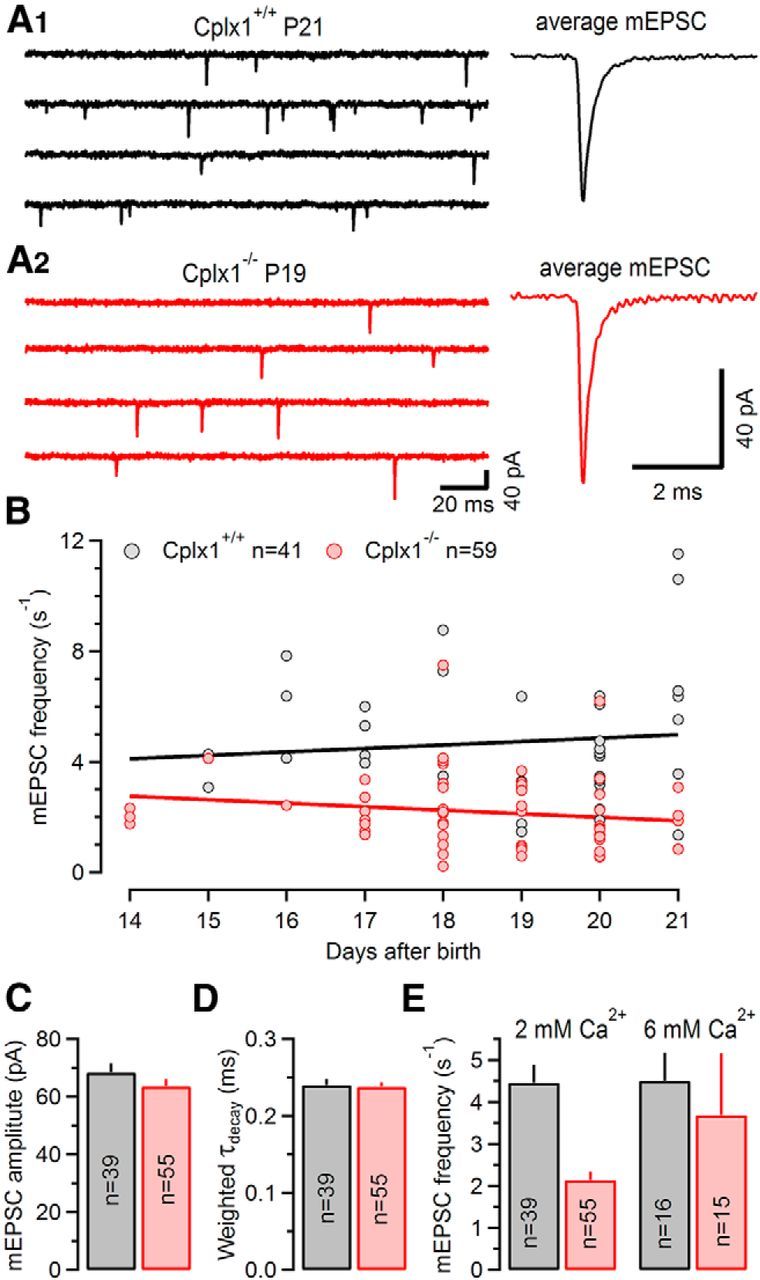
Unaltered mEPSC amplitudes and kinetics but strongly reduced frequency of spontaneous mEPSC in Cplx1−/− calyx synapses. A, Consecutive sweeps of representative mEPSC recordings (left) and corresponding average mEPSC waveforms (right) from a P21 Cplx1+/+ (A1, black) and a P19 Cplx1−/− mouse (A2, red). B, Scatter plot of average mEPSCs frequencies versus age from P14–P21 Cplx1+/+ (n = 41; gray circles) and Cplx1−/− (n = 59; red circles) mice. Solid lines represent linear regressions. Note the contrasting developmental trends in Cplx1+/+ versus Cplx1−/− calyx synapses. C–E, Summary data showing average values for mEPSC amplitude (C), mEPSC decay time constants (D), and for mEPSC frequency (E, left, normal Ca2+; right, elevated external Ca2+) in P16–P21 calyx synapses. Number of synapses analyzed as indicated. The average mEPSCs frequency of Cplx1−/− mice (red) was ∼48% of that in Cplx1+/+ (gray) mice, whereas mEPSC amplitudes and mEPSC decay kinetics were unchanged.