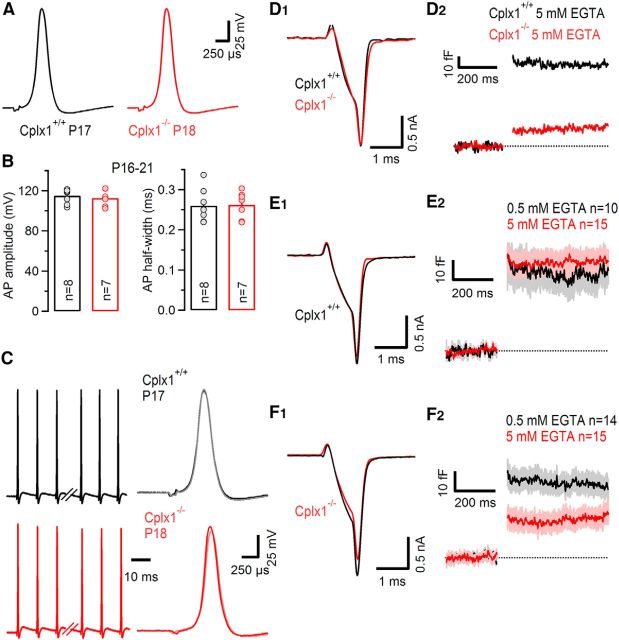
Figure 5.
Unaltered calyceal AP waveform but higher sensitivity of SV exocytosis to intracellular EGTA in P16–P21 Cplx1−/− calyx terminals. A, Representative presynaptic calyceal APs elicited by afferent fiber stimulation and recorded in current-clamp configuration in a P17 Cplx1+/+ (black) and a P18 Cplx1−/− (red) terminal. B, Average AP amplitudes (left) and AP half-widths (right) were similar in Cplx1+/+ (black) and Cplx1−/− (red) terminals. Number of terminals tested as indicated. C, AP waveform is stable during repetitive presynaptic high-frequency firing. AP trains consisting of 35 APs elicited at a frequency of 100 Hz in a Cplx1+/+ (black) and a Cplx1−/− (red) terminal. Left, The first three and last three APs in the trains. Right, The first and last AP are shown superimposed for comparison. D–F, Presynaptic Ca2+ influx (D1, E1, F1) and SV exocytosis (D2, E2, F2) in response to AP-like depolarizations (1 ms steps to 0 mV). D, Representative recordings from a Cplx1+/+ (black) and a Cplx1−/− (red) terminal with 5 mm EGTA in the pipette solution. Note the similar ICa(V) but strongly attenuated ΔCm in the Cplx1−/− calyx terminal. E,F, Average traces for ICa(V) and ΔCm recorded in Cplx1+/+ (E) and Cplx1−/− (F) terminals with either 0.5 mm EGTA (black traces) or 5 mm EGTA (red traces) in the pipette solution. Light gray and light red areas in (E2, F2) represent ±SEM. Although exocytosis in Cplx1+/+ terminals was relatively insensitive to the slow Ca2+ chelator EGTA (E), the latter attenuated the average ΔCm value by ∼50% in Cplx1−/− terminals (F).

