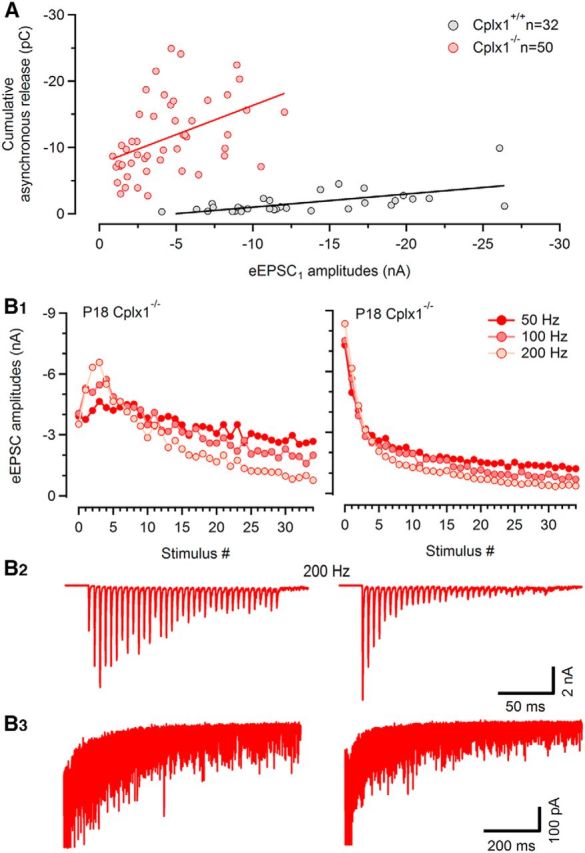
Figure 8.

Effects of Cplx1 ablation on initial eEPSC amplitudes and amount of asynchronous release after train stimuli are weakly correlated in individual Cplx1−/− synapses. A, Scatter plot of cumulative asynchronous release following 200 Hz stimulus trains versus initial EPSC amplitude for 32 Cplx1+/+ (black) and 50 Cplx1−/− (red) synapses. Note the large overlap of the two datasets with respect to initial EPSC amplitudes. In contrast, significantly higher rates of asynchronous release were consistently observed after train stimulation in Cplx1−/− synapses, even if initial, synchronous EPSCs were wt-like. B, Examples for two P18 Cplx1−/− synapses showing either low (left column) or much higher, wt-like synaptic strength (right column) to exemplify consistency among Cplx1−/− synapses regarding augmented asynchronous release despite their heterogeneous EPSC amplitudes and short-term plasticity pattern. B1, Average EPSC amplitudes obtained from three repetitions for 50, 100, and 200 Hz trains were plotted as a function of stimulus number. B2, Representative 200 Hz EPSC train sample traces for the same cells as shown in (B1). B3, Delayed release following 200 Hz EPSC trains shown expanded and at a faster time scale. Four consecutive traces are shown superimposed.
