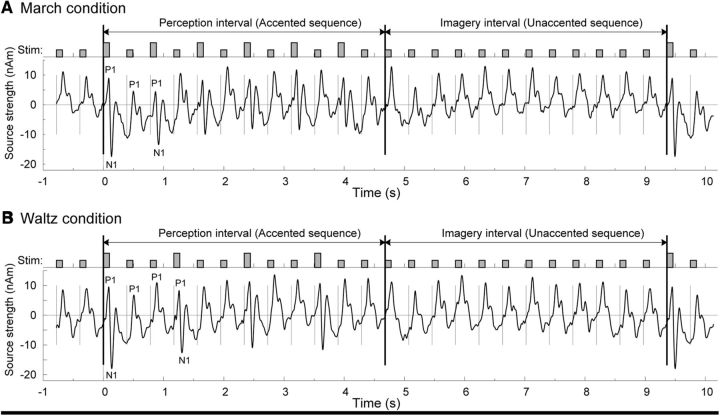
Figure 1.
Time courses of click stimuli and auditory evoked responses, grand averaged across left and right cortical sources and across all participants. Twenty-four isochronous clicks were used as auditory stimuli with an onset-to-onset interval of 390 ms. A, In the march condition, the first half of the stimulus sequence imposed the meter structure by acoustically accenting every second click. In this interval, the participants were instructed to perceive the march meter. The second half of the sequence remained at the softer intensity throughout. Here the participants had to imagine the meter structure subjectively. The evoked P1 was prominently expressed in response to each beat stimulus. In the perception interval, the auditory evoked N1 response was predominantly expressed for the accented downbeat stimuli only, whereas during the imagery interval, the evoked N1 was very small for all beats. B, For the waltz condition, every third stimulus was accented. Again, P1 responses were prominent to each beat and N1 responses followed the physically accented stimuli.

