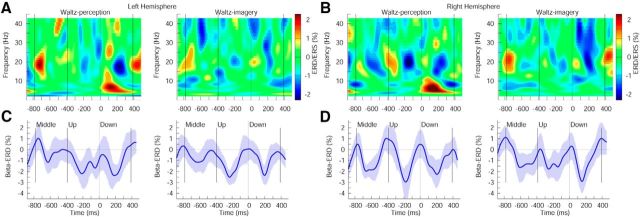
Figure 4.
Induced oscillatory activity in the left and right auditory cortex for the waltz condition. A, B, Time-frequency representation of the auditory source activity in the perception and imagery conditions, respectively, in the left (A) and right hemispheres (B). C, D, Time course of modulation of β-band activity in the left (C) and right hemispheres (D). The shaded area represents the 95% confidence interval of the group mean.

