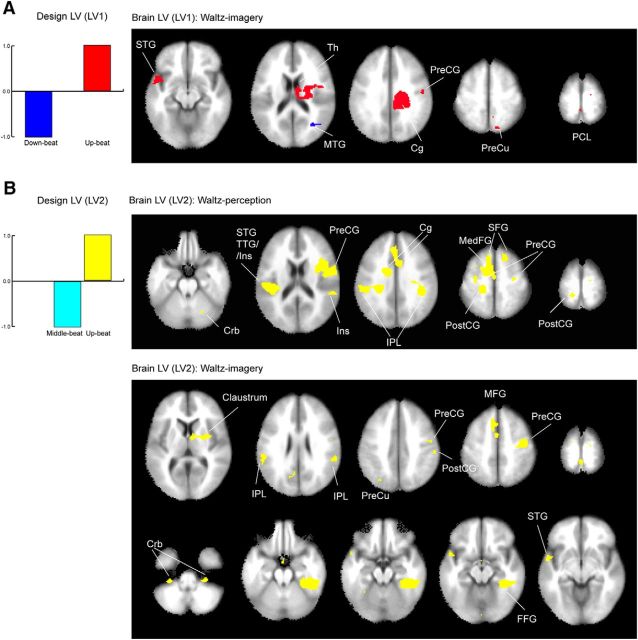
Figure 6.
The results of the PLS analysis for the β-band power that characterizes the contrast between the different beat types in the waltz condition. A, The LV1 related to the contrast between the downbeat and upbeat (left) was only significant in the waltz perception condition. The corresponding brain areas (right) demonstrate the blue colored voxels, in which the β power is more decreased for the downbeat compared to the upbeat, and the red colored areas, representing the opposite pattern. B, The LV2 related to the contrast between the middle beat and upbeat (left) was significant for both the waltz perception and waltz imagery conditions, yielding the associated brain areas (right). Note that for the LV2, in both perception and imagery, the only brain areas above the significance level were associated with the larger β-power decrease for the upbeat, compared to the middle beat. The list of the locations and Talairach coordinates are indicated in Table 2. Cg, Cingulate; Crb, cerebellum; FFG, fusiform gyrus; Ins, insula; MedFG, medial frontal gyrus; MFG, middle frontal gyrus; MTG, middle temporal gyrus; PCL, paracentral lobule; PostCG, postcentral gyrus; PreCG, precentral gyrus; PreCu, precuneus; SFG, superior frontal gyrus; Th, thalamus; TTG, transverse temporal gyrus.

