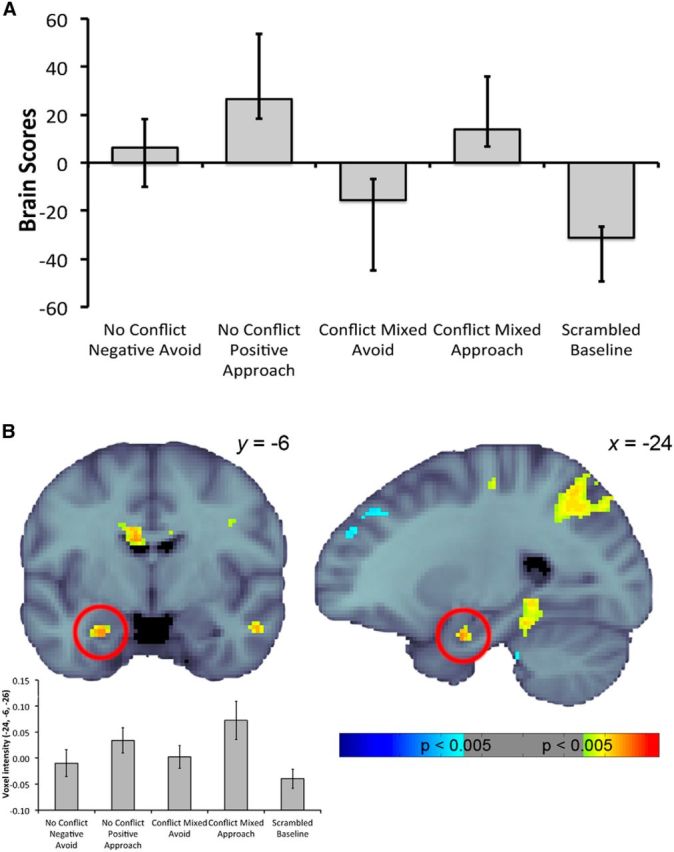
Figure 6.

A, Linear contrast associated with the latent variable differentiating approach from avoid responses for no-conflict and conflict trials. Error bars indicate 95% CIs. B, Pattern of activity relating to A at TR2, with hippocampal activity highlighted with the red circles. Warm colors indicate greater activity during conflict trials compared to no-conflict and scrambled baseline trials, whereas cool colors indicate the opposite. Activity was thresholded at a bootstrap ratio of 2.81 (equivalent to p = 0.005) and rendered on the MNI-152 standard template (the left hemisphere on the coronal slice is the left side of the image). The voxel intensities (±SE) across conditions for the hippocampal voxel contributing most robustly to this pattern are also presented for display purposes.
