Figure 3.
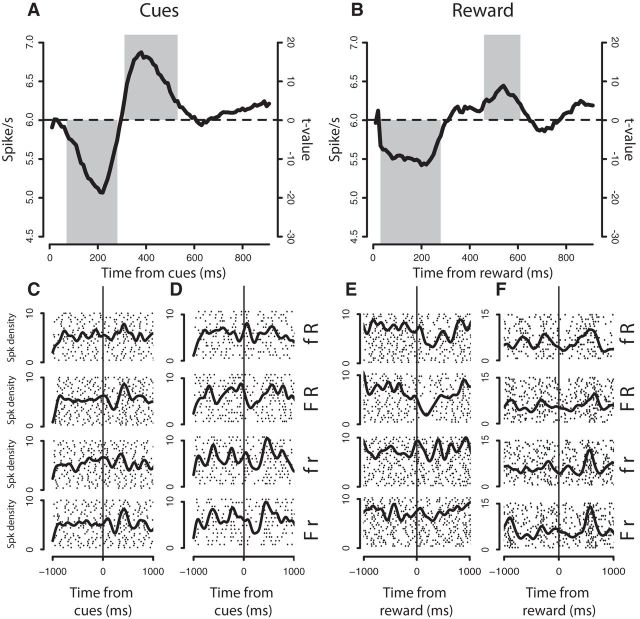
Periods of analysis after the occurrence of cues and reward. A, Population activity aligned on cue occurrence and corresponding t values of the comparison between the baseline activity and the activity during a 100 ms sliding window beginning after the occurrence of the cues. The two gray rectangles illustrate the two periods of analysis based on the statistical difference found with the baseline. The pause occurred between 60 and 280 ms, and the elevation of the discharge rate between 300 and 530 ms after cue occurrence. B, Population histogram aligned on reward occurrence (same conventions as in A). The pause occurred between 20 and 280 ms, and the elevation of the discharge rate between 450 and 610 ms after reward occurrence. C–F, Raster plots of four examples of TANs. Each line represents a trial, and each point represents a spike; the smoothed lines on the raster represent the spike density (σ = 50). Trials are ranked according to the four conditions of the task. C, Neuron showing a positive force effect during the elevation of the discharge rate after the occurrence of the visual stimuli. D, Neuron showing a negative reward effect during the elevation of the discharge rate after the occurrence of the cues. E, Neuron showing an interaction effect during the pause after reward occurrence. Its activity decreased critically in the FR condition. F, Neuron showing a negative reward effect during the elevation of the discharge rate after the reward occurrence.

