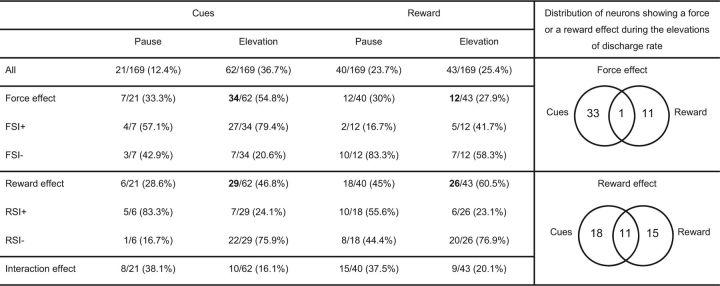
Table 2.
The row headings indicate the type of modulation (all, force effect, positive FSI, negative FSI, reward effect, positive RSI, and negative RSI) or an interaction effect
“All” corresponds to neurons showing a force, a reward, and/or an interaction effect. The columns indicate periods (cues and reward) and types of modulation (pause or elevation in discharge rate). On the right, Venn diagrams reprensent the distribution of neurons showing a force (top) or a reward (bottom) effect during the elevations of the discharge rate after the cues, the reward, or both.

