Figure 1.
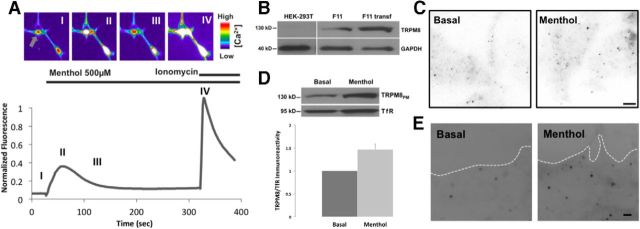
Functional endogenous TRPM8 channels are expressed in DRG-derived F11 cells and upregulated after menthol treatment. A, Calcium indicator fluorescence intensity of representative F11 cells in the presence of TRPM8 agonist. False color images of F11 cells loaded with Fluo-4 were imaged before and after 500 μm menthol stimulation, and after 1 μm ionomycin treatment. The peak fluorescence intensity was normalized to ionomycin. Gray arrow indicates the cell corresponding to the trace. Roman numerals indicate depicted frames. B, Western blot of TRPM8 in untransfected HEK293T cells, untransfected F11 cells, and F11 cells transfected with TRPM8-pcDNA3. Blotting with anti-TRPM8 antibody results in a 130 kDa band in both untransfected and transfected F11cells, indicating endogenous TRPM8 expression on lane 2. HEK293T cells were used as negative control. Cells were lysed and calibrated for equal protein loading using GAPDH (40 kDa band) as protein loading control. C, TIRFM on immunocytochemical representative samples from untransfected F11 cells before and after menthol treatment. Detection with TRPM8 antibody shows a low and discrete expression pattern of particles before menthol treatment. Samples fixed after 30 s. Menthol treatment showed a significant increase in the number of particles. Scale bar, 2 μm. D, Biotinylation assay on untransfected F11 cells shows an increase in the presence of TRPM8 channels at the PM after menthol treatment. Cells were calibrated for equal protein loading using Transferrin Receptor (TfR; 95 kDa band) as protein loading control. E, TIRFM on membrane sheet preparations before and after menthol treatment. F11 membrane sheets from untransfected cells were formed by a brief ultrasound pulse and directly fixed and stained for TRPM8 detection. Low expression of particles at the PM is observed in basal conditions (left). Samples fixed after 30 s of menthol treatment show an increase in the particle density at cell surface (right). White line indicates membrane boundaries. Scale bar, 2 μm.

