
Figure 1.
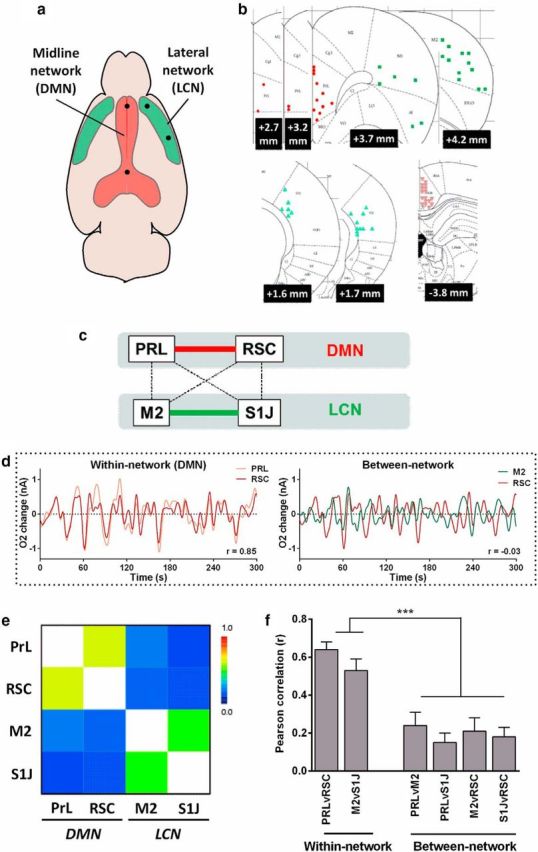
Distinct intrinsic networks measured with O2 amperometry at rest. a, O2 probes targeted two regions of the DMN (PRL and RSC) and two regions of the LCN (M2 and S1J). b, Final placements of O2 probes based on histological analysis. c, The network connectivity pairs obtained. d, Raw regional O2 signals filtered between 0.01 and 0.1 Hz from one representative animal over 5 min at rest. Left panel shows within-network regions of the DMN (PRL and RSC) with highly synchronous fluctuations. Right panel shows between-network regions (RSC and M2) with uncorrelated low-frequency fluctuations. e, Correlation matrix of functional connectivity (r) during unscheduled spontaneous behavior. f, Bar chart of connectivity of each node pair, mean r ± SEM, n = 19. Significant between-network versus within-network pair difference (***p < 0.0001).