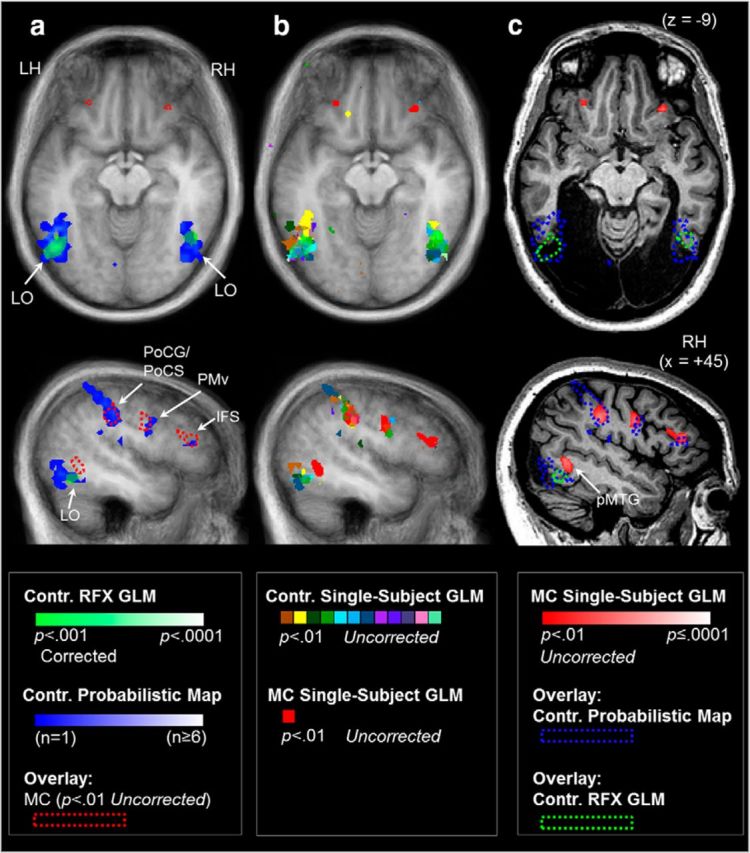
Figure 3.

Haptic shape-based activation was consistently observed within LOC in neurologically intact control participants, but not in M.C. Brain areas showing haptic shape-selectivity were identified using a conjunction analysis ([Object Different > Texture Different] AND [Object Different > Object Same] AND [Object Different + Texture Different + Object Same > Rest]) that isolated areas that were more sensitive to haptic form versus textures and fMR adaptation to haptic shape repetition. To contrast fMRI responses to haptically explored objects in M.C. with healthy controls, we computed three types of statistical maps. First, a standard statistical map based on a RFX GLM was computed to isolate voxels that were activated maximally across all controls, thresholded at p < 0.001 corrected for multiple comparisons (a; shown in green). Second, we computed probabilistic functional maps. In contrast to the RFX GLM analysis, in which activation only reaches statistical significance if there is sufficient spatial overlap between observers, probabilistic functional maps estimate the number of controls who showed activation in a given region and are used here to estimate the spatial boundary within which to expect activation from patient M.C. within LOC. The maps, illustrated in blue in a, display the number (from 1 to ≥6) or percentage (from 6% to ≥50%) of controls that showed activation in each voxel. b, Single-subject GLM activation maps of each observer are also displayed, thresholded at p < 0.01 uncorrected. For comparative purposes, a and b show functional data for all observers (including M.C.; displayed in red) overlaid on the averaged anatomical image of the control group and c displays single-subject GLM data for patient M.C., as well as the spatial extent of RFX GLM activation and probabilistic functional maps for controls (dashed lines) overlaid on patient M.C.'s anatomical image. Functional activation in the top panel is shown in an axial slice plane at the level of peak activation in the LOC in the RFX GLM analysis (z = −9). Activation in the bottom panel is shown from a sagittal slice plane (x = +45). Although above-threshold shape-selective activation in controls extended anteroventrally beyond the boundary of M.C.'s lesion, M.C. nevertheless did not show activation in the region of LOC using any of the above analysis techniques. M.C., but not controls, showed haptic shape responses more dorsally and anteriorly in right pMTG. Images are shown in neurological format (LH on left side). Contr., Controls.
