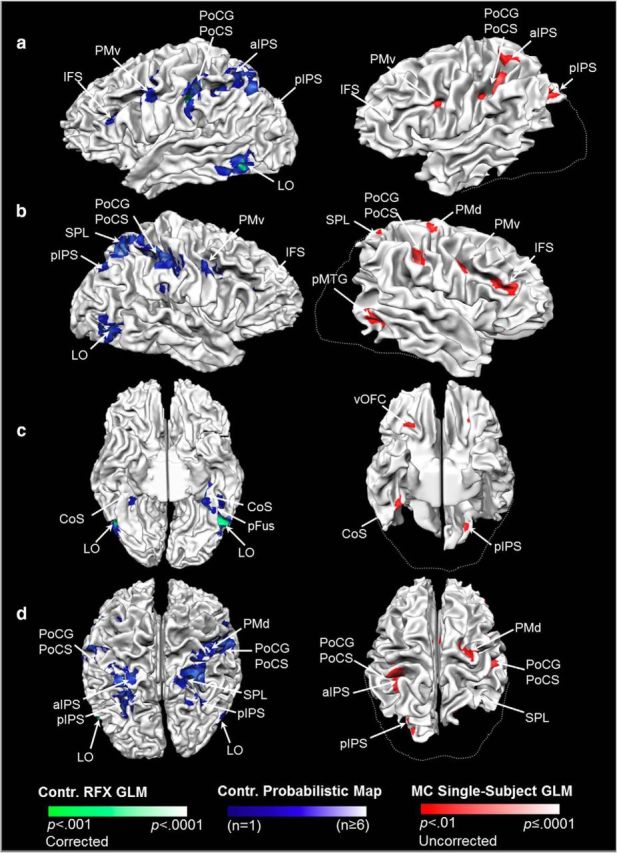
Figure 4.

Patient M.C. showed a strikingly similar pattern of haptic shape-selective activation in cortical areas outside of the LOC. The left column shows haptic shape-selective fMRI responses in controls displayed on the cortical surface of a representative participant. Activation for the control group based on RFX analysis (p < 0.001 corrected) is shown in green and probabilistic functional maps are shown in blue. The right column shows haptic shape-selective fMRI responses in M.C. rendered on her cortical surface (p < 0.01 uncorrected; right, activation shown in red). Activation on the cortical surfaces is shown from a lateral viewpoint for the LH (a) and RH (b), as well as ventral (c) and dorsal (d) viewpoints. Dashed lines delineate the approximate boundary of missing tissue in M.C. based on the control surface. Unlike healthy controls, M.C. showed a region of haptic activation ipsilateral to the palpating hand within the pMTG/ posterior superior temporal sulcus (pSTS; visible in b). This region did not overlap with LOC, as identified in the control group RFX, probabilistic map analyses, or single-subject GLM results (see Fig. 3). CoS, Collateral sulcus; pFus, posterior fusiform sulcus; vOFC, ventral orbitofrontal cortex.
